
Calculator User's Guide
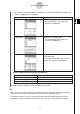
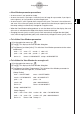
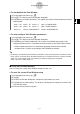
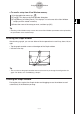
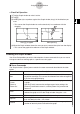
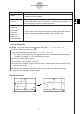
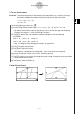
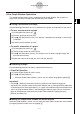
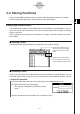
Table Of Contents
- Getting Ready
- Contents
- About This User’s Guide
- Chapter 1 Getting Acquainted
- Chapter 2 Using the Main Application
- 2-1 Main Application Overview
- 2-2 Basic Calculations
- 2-3 Using the Calculation History
- 2-4 Function Calculations
- 2-5 List Calculations
- 2-6 Matrix and Vector Calculations
- 2-7 Using the Action Menu
- 2-8 Using the Interactive Menu
- 2-9 Using the Main Application in Combination with Other Applications
- 2-10 Using Verify
- Chapter 3 Using the Graph & Table Application
- Chapter 4 Using the Conics Application
- Chapter 5 Using the 3D Graph Application
- Chapter 6 Using the Sequence Application
- Chapter 7 Using the Statistics Application
- 7-1 Statistics Application Overview
- 7-2 Using List Editor
- 7-3 Before Trying to Draw a Statistical Graph
- 7-4 Graphing Single-Variable Statistical Data
- 7-5 Graphing Paired-Variable Statistical Data
- 7-6 Using the Statistical Graph Window Toolbar
- 7-7 Performing Statistical Calculations
- 7-8 Test, Confidence Interval, and Distribution Calculations
- 7-9 Tests
- 7-10 Confidence Intervals
- 7-11 Distribution
- 7-12 Statistical System Variables
- Chapter 8 Using the Geometry Application
- Chapter 9 Using the Numeric Solver Application
- Chapter 10 Using the eActivity Application
- Chapter 11 Using the Presentation Application
- Chapter 12 Using the Program Application
- Chapter 13 Using the Spreadsheet Application
- Chapter 14 Using the Setup Menu
- Chapter 15 Configuring System Settings
- 15-1 System Setting Overview
- 15-2 Managing Memory Usage
- 15-3 Using the Reset Dialog Box
- 15-4 Initializing Your ClassPad
- 15-5 Adjusting Display Contrast
- 15-6 Configuring Power Properties
- 15-7 Specifying the Display Language
- 15-8 Specifying the Font Set
- 15-9 Specifying the Alphabetic Keyboard Arrangement
- 15-10 Optimizing “Flash ROM”
- 15-11 Specifying the Ending Screen Image
- 15-12 Adjusting Touch Panel Alignment
- 15-13 Viewing Version Information
- Chapter 16 Performing Data Communication
- Appendix

20050501
3-2-9
Using the Graph Window
k Using Quick Zoom
The seven quick zoom commands draw a graph using preset built-in View Window
parameter values.
View Window Parameter Values
Command
Quick Initialize
Quick Trig
Quick log (
x)
Quick e^x
Quick x^2
Quick –x^2
Quick Standard
xmin xmax xscale ymin ymax yscale
–7.7 7.7 1 –3.8 3.8 1
–9.424
(–3π)
9.424
(3π)
1.570
(π/2)
–1.6 1.6 0.5
–2 13.4 2 –3.8 3.8 1
–2.2 2.2 1 –1.4 9 1
–7.7 7.7 2 –10 66 5
–7.7 7.7 2 –66 10 5
–10 10 1 –10 10 1
The applicable set of View Window parameter values is applied as soon as you select a
quick zoom command on the Graph window’s [Zoom] menu.
Tip
• Any View Window parameter that is not shown in the above table is unchanged when you
execute a quick zoom command.
• When the angle unit setting is degrees, Quick Trig configures the following values.
xmin = –540, xmax = 540, xscale = 90
ymin = –1.6, ymax = 1.6, yscale = 0.5
k Using Other Zoom Menu Commands
The [Auto], [Original], [Square], [Round], [Integer], and [Previous] zoom commands are
executed as soon as you tap one of them on the Graph window’s [Zoom] menu.
For information about what each command does, see “Zoom Commands” on page 3-2-6.
Tip
• For auto zoom, you can tap the R button instead of using the [Zoom] - [Auto] menu command.
• With Integer Zoom, tap T and then use the stylus to drag the screen image so the part you
want to zoom is in the center of the screen.