
Calculator User's Guide
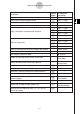
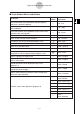

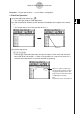
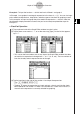
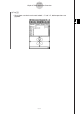
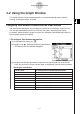
Table Of Contents
- Getting Ready
- Contents
- About This User’s Guide
- Chapter 1 Getting Acquainted
- Chapter 2 Using the Main Application
- 2-1 Main Application Overview
- 2-2 Basic Calculations
- 2-3 Using the Calculation History
- 2-4 Function Calculations
- 2-5 List Calculations
- 2-6 Matrix and Vector Calculations
- 2-7 Using the Action Menu
- 2-8 Using the Interactive Menu
- 2-9 Using the Main Application in Combination with Other Applications
- 2-10 Using Verify
- Chapter 3 Using the Graph & Table Application
- Chapter 4 Using the Conics Application
- Chapter 5 Using the 3D Graph Application
- Chapter 6 Using the Sequence Application
- Chapter 7 Using the Statistics Application
- 7-1 Statistics Application Overview
- 7-2 Using List Editor
- 7-3 Before Trying to Draw a Statistical Graph
- 7-4 Graphing Single-Variable Statistical Data
- 7-5 Graphing Paired-Variable Statistical Data
- 7-6 Using the Statistical Graph Window Toolbar
- 7-7 Performing Statistical Calculations
- 7-8 Test, Confidence Interval, and Distribution Calculations
- 7-9 Tests
- 7-10 Confidence Intervals
- 7-11 Distribution
- 7-12 Statistical System Variables
- Chapter 8 Using the Geometry Application
- Chapter 9 Using the Numeric Solver Application
- Chapter 10 Using the eActivity Application
- Chapter 11 Using the Presentation Application
- Chapter 12 Using the Program Application
- Chapter 13 Using the Spreadsheet Application
- Chapter 14 Using the Setup Menu
- Chapter 15 Configuring System Settings
- 15-1 System Setting Overview
- 15-2 Managing Memory Usage
- 15-3 Using the Reset Dialog Box
- 15-4 Initializing Your ClassPad
- 15-5 Adjusting Display Contrast
- 15-6 Configuring Power Properties
- 15-7 Specifying the Display Language
- 15-8 Specifying the Font Set
- 15-9 Specifying the Alphabetic Keyboard Arrangement
- 15-10 Optimizing “Flash ROM”
- 15-11 Specifying the Ending Screen Image
- 15-12 Adjusting Touch Panel Alignment
- 15-13 Viewing Version Information
- Chapter 16 Performing Data Communication
- Appendix
20050501
To do this:
Tap this Or select this
button: menu item:
Display the View Window dialog box to configure Graph
6
O - Settings -
window settings View Window
Display the Table Input dialog box for configuring settings 8 —
Pan the Graph window T —
Display the Variable Manager (page 1-8-1)
5
O - Settings -
Variable Manager
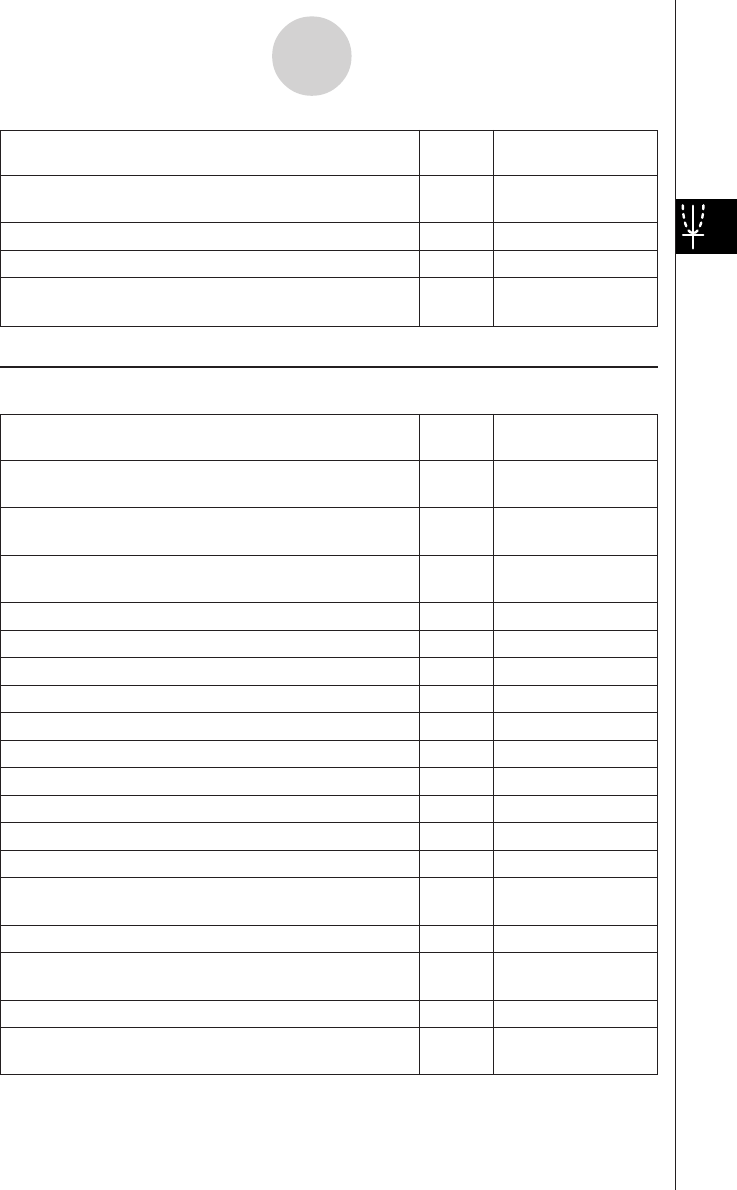
k Table Window Menus and Buttons
To do this:
Tap this Or select this
button: menu item:
Cut the character string selected in the message box
—Edit - Cut
and place it onto the clipboard
Copy the character string selected in the message box
—Edit - Copy
to the clipboard
Paste the contents of the clipboard at the current cursor
—Edit - Paste
position in the message box
Select all of the text in the message box — Edit - Select All
Clear all of the Table window contents — Edit - Clear All
Delete a line from a table — T-Fact - Delete
Insert a line into a table — T-Fact - Insert
Add a line after the currently selected line — T-Fact - Add
Draw a connect type graph using a generated table $ Graph - G-Connect
Draw a plot type graph using a generated table ! Graph - G-Plot
Save the contents of a table to a list — a - Table to List
Re-generate a table based on current table settings — a - ReTable
Delete the displayed table — a - Delete Table
Move the pointer to the location on a graph that
— a - Link
corresponds to the value selected in a table
Make the Graph Editor window active ! —
Display the View Window dialog box to configure Graph
6
O - Settings -
window settings View Window
Display the Table Input dialog box for configuring settings 8 —
Display the Variable Manager (page 1-8-1)
5
O - Settings -
Variable Manager
3-1-6
Graph & Table Application Overview