
User manual - Tests (TEST)

9
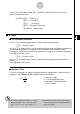
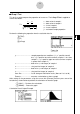
• 1(CALC) ... Performs the calculation.
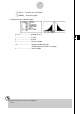
• 6(DRAW) ... Draws the graph.
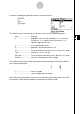
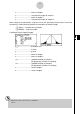
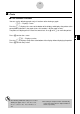
Calculation Result Output Example
µ
G11.4
........................
direction of test
z .................................. Z score
p .................................. p-value
o .................................. mean of sample
x
σ
n-1 ............................. sample standard deviation
(Displayed only for Data: List setting)
n .................................. size of sample
# [Save Res] does not save the
µ
condition in
line 2.