
User manual - Tests (TEST)

25
kk
kk
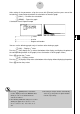
k 2-Sample F Test
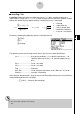
2-Sample F Test tests the hypothesis for the ratio of sample variances. The F Test is
applied to F distribution.
F =
x
1 n–1
2
σ
x
2 n–1
2
σ
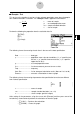
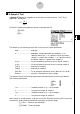
Perform the following key operation from the statistical data list.
3(TEST)
e(F)
The following is the meaning of each item in the case of list data specification.
Data ............................ data type
σ
1 ................................. population standard deviation test conditions (“G
σ
2”
specifies two-tail test, “<
σ
2” specifies one-tail test where
sample 1 is smaller than sample 2, “>
σ
2” specifies one-tail
test where sample 1 is greater than sample 2.)
List(1) .......................... list whose contents you want to use as data of sample 1
List(2) .......................... list whose contents you want to use as data of sample 2
Freq(1) ........................ frequency of sample 1
Freq(2) ........................ frequency of sample 2
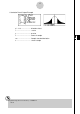
Save Res .................... list for storage of calculation results (None or List 1 to 20)
Execute ....................... executes a calculation or draws a graph
The following shows the meaning of parameter data specification items that are different
from list data specification.
x1
σ
n-1 ............................ standard deviation (x1
σ
n-1
>
0) of sample 1
n1 ................................. size (positive integer) of sample 1
x2
σ
n-1 ............................ standard deviation (x2
σ
n-1
>
0) of sample 2
n2 ................................. size (positive integer) of sample 2
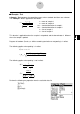
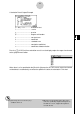
After setting all the parameters, align the cursor with [Execute] and then press one of the
function keys shown below to perform the calculation or draw the graph.
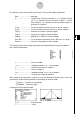
• 1(CALC) ... Performs the calculation.
• 6(DRAW) ... Draws the graph.