
User manual - Tests (TEST)

21
uu
uu
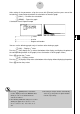
uLinearReg t Test
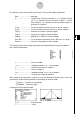
LinearReg t Test treats paired-variable data sets as (x, y) pairs and plots all data on a
graph. Next, a straight line (y = a + bx) is drawn through the area where the greatest number
of plots are located and the degree to which a relationship exists is calculated.
b =
Σ
( x – o)( y – p)
i=1
n
Σ
(x – o)
2
i=1
n
a = p – bo t = r
n – 2
1 – r
2
a : intercept
b : slope of the line
n : size of sample (n>3)
r : correlation coefficient
r
2
: c
oefficient of determination
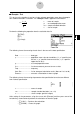
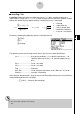
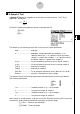
Perform the following key operation from the statistical data list.
3(TEST)
c(T)
d(LinReg)
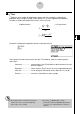
The following shows the meaning of each item in the case of list data specification.
β
&
ρ
............................ p-value test conditions (“G 0” specifies two-tail test, “< 0”
specifies lower one-tail test, “> 0” specifies upper one-tail
test.)
XList ............................ list for x-axis data
YList ............................ list for y-axis data
Freq............................. frequency
Save Res .................... list for storage of calculation results (None or List 1 to 20)
Execute ....................... executes a calculation
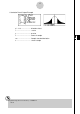
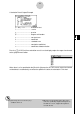
After setting all the parameters, align the cursor with [Execute] and then press the function key
shown below to perform the calculation.
• 1(CALC) ... Performs the calculation.
# You cannot draw a graph for LinearReg t
Test.