User manual - Chapter 6 Statistical Graphs and Calculations
Manuals
Brands
Casio Manuals
Calculator
ALGEBRA FX 1.0 PLUS
23
24
25
26
27
28
29
30
31
32
19990401
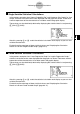
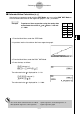
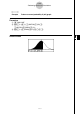
Example
T
o draw a normal probability P (0.5) graph.
Procedure
1
m
RU
N
•
MA
T
2
K
6
(
g
)
6
(
g
)
2
(SKTCH)
b
(Cls)
w
2
(SKTCH)
e
(GRPH)
b
(Y=)
3
K
6
(
g
)
1
(PR
OB)
f
(P()
a.f
w
Result Screen
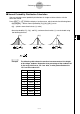
6-4-8
Pe
r
fo
r
m
i
ng Statistical Calculations
20011101
1
...
...
29
30
31
32