
User manual - Chapter 5 Graphing


19990401
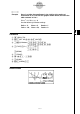
Example Read coordinates and derivatives along the graph of the function
shown below.
Y1 = x
2
– 3
Use the following V-Window settings.
Xmin = –5, Xmax = 5, Xscale = 1
Ymin = –10, Ymax = 10, Yscale = 2
Procedure
1 m
GRPH
•
TBL
u3(SET UP)ccccc1(On)i
2 !K(V-Window) -fwfwbwc
-bawbawcwi
3(TYPE)b(Y=)vx-dw
5(DRAW)
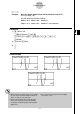
3 1(TRACE)
4 d~d
5 -bw
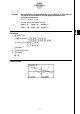
Result Screen
5-11-4
Function Analysis
19991201