
User manual - Chapter 2 Financial Calculation (TVM)

20010101
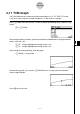
2-11 TVM Graph
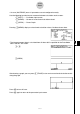
The TVM Graph lets you assign two of the five parameters (n, I%, PV, PMT, FV) to the
x-axis and y-axis of a graph, and plot changes in y as the value of x changes.
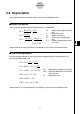
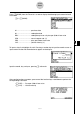
Press 5(TVMG) from the Financial 2 screen to display the following input screen for TVM
Graph.
6(g)5(TVMG)
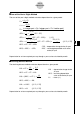
After configuring the parameters, press the function keys noted below to assign parameters
to the x-axis and y-axis.
• 1(X) ... Assigns highlighted parameter to the x-axis
• 2(Y) ... Assigns highlighted parameter to the y-axis
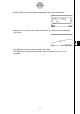
After making the required settings, draw the graph.
• 6(GRPH) ... Draws graph
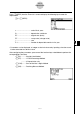
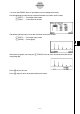
After drawing a graph, you can press 1(TRACE) to turn on trace and read calculation
results along the graph.
Press i to turn off trace.
2-11-1
TVM Graph