
User's Manual Part 4


Release8OperationsGuide
Issue2,November2007 Draft5forRegulatoryReview 484
• IP address:
• Downlink/uplink ratio:
• Max range:
• Bridge entry timeout:
• Number of subscribers:
• Method of synchronization:
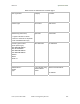
14. If you selected
Figure 29
a. Indicate how many APs are in each cluster.
b. Indicate how many AP clusters are deployed (and what types).
c. Indicate how many BH links are configured.
d. Include the IP addresses.
e. Indicate the frequency for each sector.
f. Indicate the type of synchronization.
g. Indicate how much separation exists between clusters and BHs.
h. Indicate the types of BH links (10-Mbps or 20-Mbps).
i. Distances of links.
j. Frequency used by each BH.
k. For each AP and BHM, collect the following additional information:
• Sector number:
• SW release:
• Frequency:
• Color code:
• IP address:
• Downlink/uplink ratio:
• Max range:
• Bridge entry timeout:
• Number of subscribers:
• Method of synchronization:
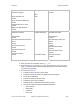
15. If you selected
Figure 30, collect the following additional information:
• Sector number:
• SW release:
• Frequency:
• Color code:
• IP address:
• Downlink/uplink ratio:
• Max range:
• Bridge entry timeout:
• Number of subscribers:
• Method of synchronization:
16. Add any details that are not present in the generic diagram that you selected.
17. Save your diagram as file Net_Diagram.