
User's Manual Part 3


Release8OperationsGuide
Issue2,November2007 Draft5forRegula toryReview 370
automatically fully displayed and refreshed. (Setting the “Auto Refresh” time back to 0 will
disable refresh.)
21.1.2 GraphicalSpectrumAnalyzerDisplay(NotavailableforCycloneOFDM)
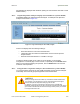
An SM/BHS displays the graphical spectrum analyzer. An example of the Spectrum
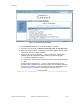
Analyzer tab is shown in Figure 137.
Figure 137: Spectrum Analyzer tab of SM, example
Colors in the display have the following meanings:
• Green bars show the most recent measurements.
• Yellow ticks show the maximum measurements from the current spectrum
analysis session.
• Red ticks show measurements of −40 dBm or stronger.
To keep the displayed data current, either set “Auto Refresh” on the module’s
Configuration => General page to a few seconds, or repeatedly click the Enable button.
When you are finished analyzing the spectrum, click the Disable button to return the
module to normal operation.
21.1.3 UsingtheAPasaSpectrumAnalyzer(NotavailableforCycloneOFDM)
You can temporarily change an AP into an SM and thereby use the spectrum analyzer
functionality. This is the only purpose supported for the transformation.
CAUTION!
When you change an AP into an SM, any connections to SMs off that AP are
lost. Therefore, you should ensure you are connected to the AP through its
Ethernet side (not RF side) before changing it into an SM.
For example, if you are connected to an AP through one of its SMs and
mistakenly change the AP into an SM, you will lose connectivity and will need to
gain access to the Ethernet side of the AP through another part of your network
to change it back into an AP.