
User's Manual Part 3


Release8OperationsGuide
Issue2,November2007 Draft5forRegula toryReview 369
21 GROWINGYOURNETWORK
Keys to successfully growing your network include
• monitoring the RF environment.
• considering software release compatibility.
• redeploying modules appropriately and quickly.
21.1 MONITORINGTHERFENVIRONMENT
Regardless of whether you are maintaining or growing your network, you may encounter
new RF traffic that can interfere with your current or planned equipment. Regularly
measuring over a period of time and logging the RF environment, as you did before you
installed your first equipment in an area, enables you to recognize and react to changes.
21.1.1 SpectrumAnalyzer(NotavailableforCycloneOFDM)
IMPORTANT!
When you enable the Spectrum Analyzer on a module, it enters a scan mode
and drops any RF connection it may have had. Scanning mode ends when either
you click Disable on the Spectrum Analyzer page, or it times out after 15
minutes and returms to operational mode.
For this reason
• do not enable the spectrum analyzer on a module you are connected to
via RF. The connection will drop for 15 minutes, and when the
connection is re-established no readings will be displayed.
• be advised that, if you enable the spectrum analyzer by Ethernet
connection, the RF connection to that module drops.
You can use any module to see the frequency and power level of any detectable signal
that is within, just above, or just below the frequency band range of the module.
RECOMMENDATION:
Vary the days and times when you analyze the spectrum in an area.
The RF environment can change throughout the day or throughout the week.
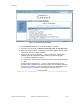
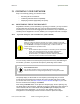
Temporarily deploy an SM or BHS for each frequency band range that you need to
monitor and access the Spectrum Analyzer tab in the Tools web page of the module.
(For access from a PDA, see PDA Access to Cyclone Modules on Page 333.) To enter
the scan mode and view readings, click Enable.
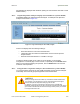
After clicking the Enable button on the Spectrum Analyzer page, the first “painting” may
not display bars for all frequencies, especially on frequency bands with a large number of
center channels, like the 5.4 GHz band. Clicking Enable again will display the entire
spectrum bar graph. Alternatively, you can set the “Auto Refresh” time on the
Configuration => General page to a few seconds to have the Spectrum Analyzer