
User's Manual

Trailblazer Installation and User Manual version 1.02 6
Zone
Frequency
(MHz)
Wavelength
(feet)
Distance to
start
(miles) (km)
Distance to
end
(miles) (km)
Fresnel Radius
(feet) (m)
60% of Zone
(feet) (m)
1 2400 0.41 2.0 3.2 2.0 3.2 46.53 14.18 27.92 8.51
2 2400 0.41 2.0 3.2 2.0 3.2 65.80 20.06 39.48 12.03
1 2400 0.41 1.5 2.4 4.5 7.2 49.35 15.04 29.61 9.03
1 2400 0.41 3.0 4.8 3.0 4.8 56.98 17.37 34.19 10.42
1 2400 0.41 4.0 6.4 10.0 16.0 78.65 23.97 47.19 14.38
1 2400 0.41 6.0 9.6 6.0 9.6 80.59 24.56 48.35 14.74
1 2400 0.41 12.0 19.2 12.0 19.2 113.97 34.74 68.38 20.84
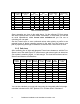
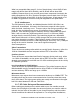
Table 1: Fresnel Zone Chart
Some examples are given in the table above. On the software CD that comes
with each system there is a folder called “Calculators”. In that folder you will find
an excel spreadsheet called fresnel zone calculator.xls you can use to
calculate your own path.
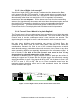
Set the Fresnel zone to even numbered values when plotting a profile to see
potential areas of phase canceling present in the path. You can improve your
path by optimizing the height of antennas so that the first Fresnel zone is clear.
2.1.5 Path Loss
After confirming line of sight and adequate Fresnel zone clearance, add the Free
Space Loss of the radio signal, RF cable losses, and antenna gains to determine
your system’s remaining signal, i.e. fade margin. The chart below shows various
antenna and distance combinations.
Distance
in miles
Distance
in km
Ant Gain
in dBi
Ext RF
Cable(s)
Path Loss
in dB
RF power
in dBm
ERP
in dBm
Link Margin
in dB
1.5 2.4 14.0 0.0 108 17 31 28.0
2.0 3.2 14.0 0.0 110 17 31 25.5
5.0 8.0 14.0 0.0 118 17 31 17.6
8.0 12.9 14.0 0.0 122 17 31 13.5
10.0 16.1 14.0 0.0 124 17 31 11.5
12.0 19.3 14.0 0.0 126 17 31 10.0
14.0 22.5 14.0 0.0 127 17 31 8.6
20.0 32.2 24.0 1.4 130 17 41 24.1
35.0 56.3 24.0 1.4 135 17 41 19.3
50.0 80.5 24.0 1.4 138 17 41 16.2
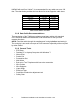
Table 2: Fade Margin Chart
You can also calculate your own path loss using the integrated radio link margin
calculator included on the CWT product CD in a folder called “Calculators”.