
User's Manual

FT-512 Trailblazer Installation and User Manual version 1.09 8
2.3.2
Fresnel Zone, What is it, in plain English?
In plotting terrain profiles for microwave frequencies, there are both direct and
deflected waves that converge upon the receiving point. The direct path has a
predictable behavior. Calculating losses from indirect or “deflected” signals
however requires a different approach.
To calculate the losses of the indirect signals, let us look at what occurs. As the
signal cone spreads outward from the transmitting point, it becomes increasingly
delayed from the original. That delay will show up as a phase change from the
original. As that phase approaches 180 degrees, this delayed signal will have a
significant phase-canceling effect on the direct signal. As the signal continues to
widen, peaks and troughs in reception strength similar to a sine wave occur.
Each peak and trough is called a Fresnel zone.
The first Fresnel zone is the radius of the signal cone in which the phase angle of
the signal can be delayed from 0 to as much as 90 degrees. This is where the
majority of the signal power is supposed to exist. The second Fresnel zone will
cover from 90 to 270 degrees and is undesired as it only causes the negative
effect of phase canceling. The third zone will have signal delays from 270 to 450
degrees. The effect is that odd number zones will add to the direct signal and
even number zones will subtract.
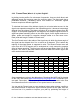
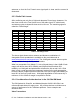
Zone Frequency Wavelength Distance to start Distance to end Fresnel Radius 60% of Zone
(MHz) (feet) (miles) (km) (miles) (km) (feet) (m) (feet) (m)
1 2400 0.41 2.0 3.2 2.0 3.2 46.53 14.18 27.92 8.51
2 2400 0.41 2.0 3.2 2.0 3.2 65.80 20.06 39.48 12.03
1 2400 0.41 1.5 2.4 4.5 7.2 49.35 15.04 29.61 9.03
1 2400 0.41 3.0 4.8 3.0 4.8 56.98 17.37 34.19 10.42
1 2400 0.41 4.0 6.4 10.0 16.0 78.65 23.97 47.19 14.38
1 2400 0.41 6.0 9.6 6.0 9.6 80.59 24.56 48.35 14.74
1 2400 0.41 12.0 19.2 12.0 19.2 113.97 34.74 68.38 20.84
Table 1: Fresnel Zone Chart
Some examples are given in the table above. Download the MS Excel file located
on the CWT web site at www.carlsonwireless.com/support.html to calculate your
own path. Remember, 60% or more of the first Fresnel zone needs to be clear
from obstructions for the calculation of free space losses to be accurate.
You can set the Fresnel zone to even numbered values when plotting a profile to
see potential areas of destructive signal reflection present on the path. One can
now see how it is possible to improve your path by optimizing the height of