
User Manual


Energy management
M-Bus Communication Protocol for EM24 M1
8
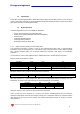
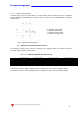
2.1.1 Geometric representation
According to the signs of the power factor , the active power P and the reactive power Q, it is possible to
obtain a geometric representation of the power vector, as indicated in the drawing below, according to
EN 60253-23:
Fig. 1 : Geometric Representation
a = Exported active power
b = Imported active power
c = Imported reactive power
d = Exported reactive power
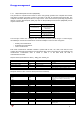
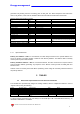
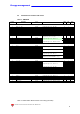
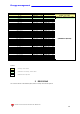
2.2 Maximum and minimum electrical values
The maximum electrical input values are reported in the following table. If the input is above the
maximum value the display shows “EEE”.
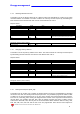
Table 2.2-1 – EM24 M1 (MID and non MID versions)
AV9 input option AV2 input option AV5 input option AV6 input option
Max value Min value Max value Min value Max value Min value Max value Min value
VL-N 280V
0
280V
0
280V
0
133V
0
VL-L 485V
0
485V
0
485V
0
230V
0
A 65A
0
65A
0
11A
0
11A
0
VT ratio
6000
1.0
6000
1.0
CT ratio
60000
1.0
60000
1.0
The overflow indication “EEE“ is displayed when the MSB value of the relevant variable is 7FFFh.
The overflow indication “-EEE“ is displayed when the MSB value of the relevant variable is 8000h.