
Installation guide


24
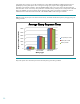
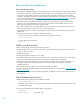
For the last concurrent test the same 5TB of raw user data was used. No materialized views were used and this time
all the data was actively queried. Tests were done in 100, 200, 300, 400 and 500 concurrent queries. The
DL980/P2000 was able to consume most available resources when executing 100 concurrent queries all at the same
time. This was due to the Oracle parallel management configuration set in the init.ora parameter file. You will notice
as we increased the number of concurrent queries from 100 to 200, 300, 400 and 500 that the more complex
intermediate and advanced query response times increased in a linear fashion (figure 12). Since most system
resources were consumed with 100 concurrent queries the remaining queries were waiting in the parallel queue to be
executed. You will also notice that the smaller queries executed in serial rather than parallel due to the
parallel_min_time_threshold value being set to allow parallel execution to be disabled. The entry level queries had a
less than linear increase in execution time as we scaled up concurrency due to the serial execution of these types of
queries and limited dependency on parallel processes.
Keep in mind that these tests show the number of queries executing in parallel streams from query generators, which
is far more taxing than an actual production environment where connected users would have some think time
between issuing queries. The query generator will immediately issue a new query as soon as the previous query
finishes, thus insuring a constant number of queries being issued to the system. In production environments connected
users will not always have an active query working on the system as there is substantial think time between queries
with analytic workloads.
The DL980/P2000 performed very well through all tests, but it is essential to size the memory correctly. Larger
numbers of concurrent queries consume a lot more PGA memory that can force the system to begin to swap and
eventually become unstable. This can be fixed by resizing the memory allocation for Oracle as shown in Appendix 2.
Figure 12. Average query response times for entry, intermediate and advanced queries as we increased the workload
0
1000
2000
3000
4000
5000
6000
7000
8000
100 200 300 400 500
Response Time in Seconds
Number of Concurrent query streams
Average Query Response Times
Entry
Intermediate
Advanced