
Installation guide


23
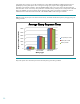
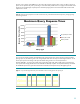
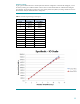
However, note in figure 10 the difference it can make to the maximum response time a query can take to execute if
queries are not queued. They end up executing in serial rather than parallel which is a single process that takes much
longer time to complete larger complex queries. Alternatively large queries can be terminated if the minimum DOP
requirement is not met.
Figure 10. Maximum Query Response Time results of 200 mixed entry, intermediate and advanced queries by changing queuing
and caching parameters
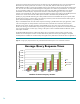
If you review the Oracle Automatic Workload Repository (AWR) report when queries are being executed with the
queuing option set, the following wait event will typically be observed in the Top 5 Timed Foreground Events. To see
which of your queries are waiting in the queue the Oracle v$sql_monitor view can be queried for a
STATUS=’QUEUED’. You may notice a fairly long wait for direct path read. What it really means is that 8 queries
were queued until enough parallel slaves were available to efficiently complete. The important takeaway is both that
the AVERAGE response time goes down because the overall CPU consumption and I/O throughput goes UP.
Figure 11. Top 5 Timed Foreground Events you should observe when executing queries with queuing set
Event
Waits
Time(s)
Avg wait (ms)
% DB time
Wait Class
DB CPU
65,589
43.36
resmgr:pq queued
8
31,366
3920695
20.74
Scheduler
direct path read
407,708
10,823
27
7.16
User I/O
read by other session
39,094
997
26
0.66
User I/O
db file scattered read
39,574
875
22
0.58
User I/O
0
2000
4000
6000
8000
10000
12000
Entry Intermediate Advanced
Response Time in Seconds
Query Type
Maximum Query Response Times
No queue/No cache
Queue/No cache
Queue/Cache