
Installation guide


21
Another test2 was done using a 138GB table. The first query scan produced around 17 GB/s throughput rate
according to vmstat. This result was very similar to test1 but with a lot of I/O wait.
The scan time was 8.19 sec. or 17 GB/s. The same test2 query scan was executed again with parallel caching on.
The results produced slightly lower I/O scan rates at 15GB/s according to vmstat. Also there was much higher user
CPU consumption at 41% compared to 14% without parallel caching. The first test2 results had the processes just
waiting in I/O wait state compared to much lower I/O waits for the second test2 test which was executed using the
buffer cache.
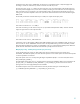
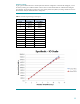
The OS utility vmstat shows read rate data of up to 15GB/s for complex Oracle query test2.
procs -----------memory---------- ---swap-- -----io---- --system-- -----cpu------
r b swpd free buff cache si so bi bo in cs us sy id wa st
39 222 125244 205236384 4996336 72880352 0 0 15248480 0 131463 44024 44 3 4 49 0
62 205 125244 205234144 4996336 72880352 0 0 14903900 8 128891 44026 41 3 5 51 0
Test2 scan time was 8.81 sec. or 15.6GB/s.
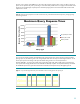
Test3 scan with caching on. The result was very low I/O (most data cached) less than 3GB/s. However the CPU
usage was high at 99% for a short period of time.
procs -----------memory---------- ---swap-- -----io---- --system-- -----cpu------
r b swpd free buff cache si so bi bo in cs us sy id wa st
252 9 125244 205255616 4996336 72881184 0 0 2355766 44 87425 38368 42 1 57 0 0
249 11 125244 205240224 4996336 72881192 0 0 3023751 0 150553 46370 99 1 0 0 0
241 6 125244 205238688 4996336 72881192 0 0 1883235 8 146579 46369 99 1 0 0 0
Test3 scan time was 3.93 sec., half of test2 time.
A test4 query was run after reading a different large table and flushing the cache with different data. The new scan
time was 9.24 sec. for the 138GB table. However in this case the parallel caching cannot be controlled, and often
these large tables get flushed out, resulting in wasted buffer cycles. It is recommended to carefully test this feature for
specific customer workloads to determine the actual benefit or penalty that can be incurred.
Multiple query testing – Parallel queuing tests with query concurrency
To test parallel queuing of a large user data (5TB) a large volume of 200 mixed concurrent queries (entry,
intermediate, and advanced queries) were used. This test represents a more realistic picture of what can be expected
in customer production environments.
Entry level queries were run in serial by setting the degree of parallelism (DOP) to 1 at session level {alter session
force parallel query parallel 1;}
The intermediate queries were set to use 16 DOP processes and queuing enabled by adding a hint parameter to the
sql query code, { /*+PARALLEL(16) STMT_QUEUING */ }, also parallel_min_percent was set to 25% to force
queuing if there are not enough parallel processes available.
The advanced queries were set to 32 DOP with the same hint parameter settings as intermediate queries
({ /*+PARALLEL(16) STMT_QUEUING */ }, and parallel_min_percent =25).