
Installation guide

20
Note
If you are doing a proof of concept (POC) where typical testing is running single
queries to see how they perform, it is recommended to set
parallel_degree_policy to manual. Otherwise the performance of single queries
may not be as good. The benefits of auto will be for multiple user concurrency
type tests.
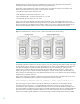
For the larger more complex queries we used the large 32k blocks for large fact tables (Oracle parameter
db_32k_cache_size). This will allow fewer Oracle buffer blocks for the system to be managed when querying very
large objects in the data warehouse. For smaller tables 8k block size was used.
Measured performance
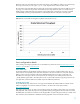
During our performance testing, we used simulated sequential read workloads that are more “real world” than
marketing specifications to gauge performance. These tests use workloads with varying sizes ranging from 100 to
500 concurrent queries, running simple, intermediate and advanced queries. From the results of these tests we
determine both logical (how fast data can be read from buffer cache) and physical (how fast data can be read from
physical disk) scan rates when turning on and off parallel caching. Table 11 below lists the observed scan rates for
this configuration.
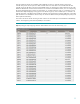
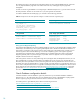
Table 11. Scan rate results for a customer realistic workload showing the results of using parallel caching
Test Scan Rate Type
Test Scan Rate
Comment
Test workload with parallel
caching turned off
Scan time 8.19 sec.
17 GB/sec
Physical I/O
Test workload with parallel
caching turned on
Scan time 3.93 sec.
35 GB/sec
Logical I/O
Average I/O
9.4 GB/sec
This is the average of the physical scan rates
Results of Parallel Query Execution testing
Single query testing – Parallel_cache tests
Tables scans were performed by calculating the sum of a single column in a large 1TB table with no predicate
filtering, thus forcing the 11gR2 Oracle database to read the complete table every time (full table scan). Caching of
any data in the db buffer blocks was turned off during this test. This test1 using 1TB table query scan resulted in no
caching and the table was read from disk every time with the Oracle init.ora parameter 32k_cache_size set to
550GB.
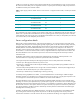
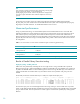
The OS utility vmstat shows read rate data of up to 17GB/s for complex Oracle query test1.
procs -----------memory---------- ---swap-- -----io---- --system-- -----cpu------
r b swpd free buff cache si so bi bo in cs us sy id wa st
22 237 125248 201308192 4996324 72876672 0 0 17718496 292 92093 29623 14 3 7 77 0
24 236 125248 201150432 4996324 72876864 0 0 17197216 32 91338 28599 14 2 9 75 0
24 233 125248 201146736 4996324 72876864 0 0 16751136 68 90546 28281 14 2 6 78 0
34 226 125248 201145056 4996324 72876864 0 0 17154880 16 91658 27400 14 2 9 75 0
The same test1 query scan was executed again but this time turning caching on. The end results were very similar.
Oracle 11gR2 determined that the table and data being read was much larger than the available cache and avoided
trying to cache the table. There are parameters in Oracle 11gR2 to control Oracle’s parallel query caching specific
behavior.