
Instruction manual


A-1
APPENDIX A. TROUBLESHOOTING THE RTMS NETWORKS
A.1 STATION TEST
The best tool for determining network status is
NetAdmin. Examine the network health screen
(main NetAdmin screen). Is each station shown
on the NetAdmin network health screen?
Stations must be part of the Net Description if
data is to be collected.
If a station is not shown, check the following:
• If the station was never added to Net
Description, it should be added. Otherwise
the Net Description has been changed or
has become invalid (computer or hard disk
failure/crash).
• Reload Net Description from netname.NET
file. If netname.NET file is corrupt or missing,
restore a good copy from backup. If a good
netname.NET file is unavailable, re-enter Net
Description by hand The netname.TXT file
can be used if a good copy exists.
NOTE: Netname is the name the user
specified when the Net Description was
saved. Whenever the Net Description is
changed select the MAKE THE OPEN NET
DESCRIPTION ACTIVE option found under
the FILE selection on the EDIT NET
DESCRIPTION menu.
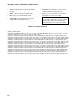
• Total number of stations being collected from.
• The COLLECTING RECORDS FROM ______
STATIONS indicator. This box indicates the
total number of stations where data is being
retrieved for RTM or DBSelect. If this number
is less than expected, try the communication
test listed in Section 1.2.
A1.2 COMMUNICATION TEST
Use this section to determine if the computer
and datalogger are communicating.
View each station on the NetAdmin main screen
noting the color and the time of the last data
collected. Is the time of last data current and the
color of each station green? If so communication
with the station is probably fine. If not, check the
time of last data displayed on the screen. If it is
current communication with the datalogger is
probably fine (see Section 1.3.).
If not, there are two things to check:
• Check if Terminal Mode or a clock check
with the datalogger works. If it does work,
communication with the datalogger is
probably fine, but data is not being
collected. Data collection can stop because
the datalogger program has been changed,
datalogger was reset due to battery failure,
communication has been paused, or data is
no longer being requested by DBSelect
and/or RTM (see Section 3).
• If the clock check or Terminal mode fails,
there is probably a communication problem
with datalogger. See Section 2
A1.3 CHECK LAST 12 HOURS OF
COMMUNICATION
Check communications indicators for last 12
hours (COMMS 12HR) on the network health
display. There are 72 pixels each representing
a 10 minute period of the last 12 hours (720
minutes), and one pixel for the current 10
minute period. The color of each pixel
represents the “worst” type of message that
occurred during the period. If any faults
occurred the pixel will be red. If warnings
occurred but no faults, the pixel will be blue. If
no warnings or faults occurred, only successful
communications, the pixel will be green. If no
pixel is drawn, no communication took place.
The height of the trace (each pixel) is
determined by the ratio of successful
communications to total communications during
the 10 minute period. If the trace is high and
green then communication is good. If the trace
is high and occasionally blue, communication is
still probably good. With most communication
links serial errors will occur as characters are
occasionally missed. This results in a warning
message like those described in Section 4.
These can occur more frequently on machines
that run OS/2 more slowly, i.e., 386 with 8 meg.
RAM and where polling is done frequently.
These serial errors are retried and usually
succeed. Repeated failure will result in a fault
message being generated. If a trace is red and
very low then some problem does exist (see
Section 2).