
Instruction manual


SECTION 6. RTM (REAL TIME MONITOR)
6-3
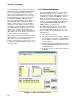
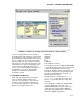
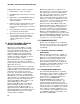
FIGURE 6-2. RTM Screen Showing Station.Table.Field for a Numeric Display
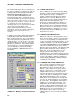
To move a display, place the mouse pointer on
the display and click the left button. A four-headed
arrow will appear. Press and hold the left mouse
button and drag the display until it is in the desired
location. Clicking on some areas of the display
may not show the arrow, for example, the actual
strip chart area of the strip chart. Experience will
show which areas can be used. Dragging can be
used to position the display anywhere on the
screen; even on another display or partially out of
the template area. However, the part that is
partially covered will not be updated when
monitoring is started.
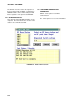
6.1.6 DEFINING THE DISPLAY
Each data value displayed must be defined in
terms of a Station.Table.Field expression.
These are selected from lists of those that are
available. These data display definitions can
also contain math expressions. The following
displays do not support expressions:
NumGroup
StripChart
Port/Flag
Input Loc
Ruler
RecDisplay
Text and Time of Last Rec
For example the expression "(DALLAS.MIN.TEMP)
*1.8+32" would take the temperature collected from
a station named "DALLAS", and convert it to
Fahrenheit. Available operators and functions are
listed below. Expressions may optionally contain
parentheses and floating point constants (e.g.,
Station.Table.Field - 32/1.8).
Available Operators and functions are: +, -, *, /,
>, >=, =, <=, <, <>, Not, Mod, Or, PF, Xor, And,
Sin, Cos, Log, Sqrt, Exp, Abs, Ave, Time, Pow,
and Trunc.
The resulting value could then be displayed with
any of the displays (e.g., bar chart). The
"(DALLAS.MIN.TEMP)" part of the expression is
a data value from a station named "DALLAS"
with a table named "MIN" (minute output) and a
field named "TEMP" (temperature).