
Instruction manual


SECTION 6. RTM (REAL TIME MONTIOR)
6-2
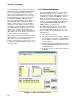
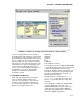
6.1.2 CREATING A TEMPLATE
Creating a template consists of adding the
desired displays to the template. Data displays
are used to display data retrieved from the
dataloggers or to issue control commands to a
datalogger. This includes numeric, bar chart,
strip chart, X-Y plots, and other displays.
Accessory displays are used to enhance data
displays and give information about the computer.
Accessory displays include rulers (scales), text,
and computer date/time. Adding a new display
(either type) uses four basic steps repeated for
each display added. The four steps are:
1. Select the display to be added.
2. Position the display.
3. Describe/define the display.
4. Size the display.
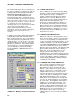
6.1.3 SELECTING A DISPLAY
While in Edit mode, the cursor gives a visual
indication of the currently selected display type
while the cursor is positioned in an unused area
of the template. A display of the currently
selected type may be placed without using the
menu. If a different type display is desired,
move the cursor to 'INSERT' on the main menu.
The cursor will change back to the standard
pointer when the cursor leaves the template
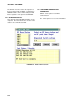
area. Selecting INSERT gives a list of the
available displays. Highlight and select the
desired display. This becomes the default
display type until a different display type is
selected. The cursor will give visual confir-
mation of the display type selected when it is
placed back in the template area.
6.1.4 AVAILABLE DISPLAYS
The following displays are available under the
INSERT submenu:
NUMERIC − Displays single numeric field with
label. Allows color of label to be selected.
Display grays when data becomes old. Used to
set alarms. Label text color can be selected.
NUMGROUP − Used for easy selection of
multiple numeric fields from same datalogger
and table. Automatic arrangement and labeling
of fields.
BIG NUMERIC − Uses a large font, making
single numeric display stand out and easy to
read.
STRIP CHART − Plots up to 12 traces against
time. Each display can have a separate color
and separate Y axis. Simple cursor mode allows
numeric display of trace values.
X-Y PLOT − Plots points based on two fields;
one for the X value and one for the Y value.
BAR CHART − Rectangular box with color filled
height proportional to value. Allow selection of
color, minimum value, and maximum value.
PORT OR FLAG − Displays port or flag status.
Optionally allows port or flag to be toggled with
mouse. Ports and flags can be labeled for easy
identification.
INPUT LOC − Displays single numeric value.
Allows value to be edited, changing value in
datalogger.
CONTROL − Allows port, flag, numeric value
conditions in one datalogger to be used to
change port, flag, or Input location in another
datalogger.
RULER − Used to add scale to bar chart, etc.
Horizontal or vertical orientation with user
specified number of tick marks.
WIND VECTOR − Compass-like display of wind
speed and direction. Also numerically displays
wind speed and direction. Optionally leaves
dots for up to 99 values giving some historical
information.
RECORD DISP − Tabular display of entire data
table. Will scroll vertically through buffered
records. Buffers as many records as will fit in
32K characters. Scrolls horizontally for tables
wider than display.
TEXT − Places text on template. Allows
selection of text color.
TIME ON LAST REC − Gives time stamp of last
data received from selected station.
CURRENT TIME − Displays computer time
information on template.
6.1.5 POSITIONING THE DISPLAY
Once the display type has been selected, a
display of that type can be placed on the
template. A display is placed by moving the
mouse cursor to the desired position on the
template and clicking the left button once. The
mouse cursor position is where the lower left
hand corner of the display will be. A dialog box,
used to define the display, will appear when the
button is clicked. After the dialog box is filled
out, the actual display will appear.