
Instruction manual


6-1
SECTION 6. RTM (REAL TIME MONITOR)
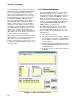
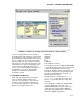
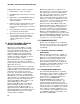
RTM is used to monitor data values from stations in the RTMS network. RTM offers a variety of data
displays including strip charts, bar charts, numerical displays, X/Y plots, etc. Multiple data displays, text,
rulers, and drawings (maps) can be combined by the user into a single template (Figure 6-1). Once cre-
ated, a template can be named and saved for later use.
RTM has two modes; Edit and Monitor. The mode is changed from the mode submenu, accessed by
selecting MODE on the main menu.
6.1 EDIT MODE
The edit mode is used to create new templates
or edit existing templates. RTM automatically
enters the edit mode when it is started. When
RTM is monitoring, selecting EDIT from the
MODE submenu will halt the monitoring and
RTM will enter the edit mode.
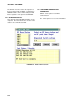
6.1.1 BACKGROUND COLORS AND BITMAPS
(MAPS OR DRAWINGS)
Normally RTM templates have a solid white
background. Select BKGND COLOR from the
OPTIONS submenu (on the main menu) to
change the background color. If desired, a map
or drawing can also be used as the background
to give additional information about the
displayed data. For example, a map may be
used to show where the data was collected.
RTM will display .BMP type files. Many paint
and screen capture programs create .BMP files.
For example the paint program supplied with
WIN-OS2 can create bitmap files. Bitmaps are
added by selecting BITMAP BKGND from the
submenu displayed when OPTIONS is selected
on the main menu. Bitmaps are referenced to
the lower left corner of the display and must be
large enough to cover the desired area.
FIGURE 6-1. RTM Template Using Strip Chart, Bar Chart, and Numerical Displays