REAL TIME MONITORING SOFTWARE (RTMS) INSTRUCTION MANUAL 2/95 COPYRIGHT (c) 1995 CAMPBELL SCIENTIFIC, INC.
LIMITED WARRANTY Campbell Scientific, Inc. warrants that the magnetic diskette on which the accompanying computer software is recorded and the documentation provided with it are free from physical defects in materials and workmanship under normal use. Campbell Scientific, Inc. warrants that the computer software itself will perform substantially in accordance with the specifications set forth in the Operator's Manual published by Campbell Scientific, Inc. Campbell Scientific, Inc.
LICENSE FOR USE This software is protected by both United States copyright law and international copyright treaty provisions. You may copy it onto a computer to be used and you may make archival copies of the software for the sole purpose of backing-up Campbell Scientific, Inc. software and protecting your investment from loss. All copyright notices and labelling must be left intact.
REAL TIME MONITORING SOFTWARE (RTMS) TABLE OF CONTENTS PAGE SECTION 1. RTMS SYSTEM OVERVIEW ............................................................................. 1-1 SECTION 2. OS/2 OPERATING SYSTEM 2.1 2.2 2.3 User Interface ......................................................................................................................... 2-1 Priority, Multitasking, and System Resources ........................................................................ 2-1 Restarting OS/2 ............
APPENDIX A. TROUBLESHOOTING THE RTMS NETWORKS A.1 A.2 A.3 A.4 Sample ASCII File Created by DBSelect................................................................................A-1 Communication Problems ......................................................................................................A-2 Computer Communicates with Datalogger, but RTM is not Displaying Data, and/or DBSelect is not Storing or Routing Data ................................................................................
SECTION 1. RTMS SYSTEM OVERVIEW Real Time Monitoring Software (RTMS) is PC software designed to enhance the capabilities of the CR10T and future Campbell Scientific dataloggers. RTMS provides data collection, monitoring, and control for applications involving one or more CR10T dataloggers. RTMS is designed to do several tasks concurrently. OS/2 was chosen as the operating system. Using OS/2 multitasking, data can be collected, displayed, analyzed, routed, and archived simultaneously.
REAL TIME MONITORING SOFTWARE COMPONENTS OF RTMS BMP − Block Mode Protocol, use to communicate with dataloggers, etc. DBSelect − Data collection for storage, and routing including TCP\IP, named pipes, and ASCII files. This is data for archive or routing to another computer. DlsMgr − DataLogger Services ManaGeR. Manages all communication with datalogger network. Provides uniform interface for other programs requiring datalogger services. Starts automatically when needed by other programs.
SECTION 2. OS/2 OPERATING SYSTEM 2.1 USER INTERFACE Before RTMS can be installed, OS/2 (Version 2.1 or newer) must be installed and running. The SYSTEM MONO-SPACED FONT should be installed (this is default) as part of the OS/2 installation. Running the tutorial provided with OS/2 is a good way to become familiar with the OS/2 user interface. The manual ‘Using the Operating System’ provided with OS/2 also provides a good introduction to the OS/2 Workplace Shell.
SECTION 2. OS/2 OPERATING SYSTEM • Sluggish responses to mouse and keyboard. • Low memory warning on NETADMIN network health screen. • Real time displays (e.g., strip charts) do not keep up. • Status, warning, fault messages indicating queue overflows. • DBSelect stop collecting due to insufficient hard disk space or because the Named Pipe breaks. Some suggestions to diagnose and remedy these kinds of problems: • Keep plenty of disk space free.
SECTION 3. GETTING STARTED WITH RTMS 3.1 RTMS INSTALLATION To install RTMS, select a full OS/2 screen or an OS/2 window. Change to the drive containing the RTMS disk #1. At the OS/2 prompt type INSTALL followed by ENTER. Follow the prompts given. The installation program allows the user to select whether it should modify the CONFIG.SYS file. When the changes are enabled, the install program: • Adds the RTMS directory to the SET PATH directories. • Adds the RTMS directory to the LIBPATH directories.
SECTION 3. RTMS INSTALLATION 3.3 RTMS STARTUP OVERVIEW Campbell Scientific dataloggers are general purpose and require programming for specific applications. The datalogger manuals describe datalogger programming. EDLOG is a prompting editor for creating datalogger programs. EDLOG runs in a DOS window or full screen. The RTMS installation program created an icon for EDLOG. A separate manual contains information on using EDLOG.
SECTION 4. DLSMGR 4.1 INTRODUCTION DataLoggeR Services ManaGeR (DlsMgr) provides all communication with the datalogger network. RTMS users do not interact directly with DlsMgr but it is helpful to have an understanding of how it works. DlsMgr is given information regarding the layout of the network as a Net Description. NetAdmin provides DlsMgr with this description based on user-entered parameters.
SECTION 4. DLSMGR remote, the RF base will direct the packets to the CR10T using the specified path and return the response as soon as possible. If directly routed packet deliveries fail, the base will attempt several retries. Retries are done at the end of each polling cycle for remotes that failed to respond to the broadcast.
SECTION 5. NETADMIN 5.1 OVERVIEW NetAdmin provides seven basic functions for setting up and maintaining the network. The network health is displayed on the NetAdmin main screen. The other functions are accessed from the submenu displayed when VIEW is selected from the NetAdmin main menu. Each function is briefly introduced here and described in detail in following sections.
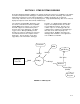
SECTION 5. NETADMIN parent-child organization or a tree structure. Basically the structure starts with the Computer (PC1) at the top, a datalogger (CR10T) at the end of each branch, and various communication hardware in between. Each entry in the structure is referred to as a node. In the pictorial representation, a child node is listed under its parent and indented to the right. Some examples should help clarify this structure. Consider a PC with a CR10T attached to each of its four serial (COM) ports.
SECTION 5. NETADMIN FIGURE 5-1. Initial NetAdmin Screen As the network is constructed, the left part of the screen will visually indicate the network as it is described. The right part of the screen will show the specific parameters for the node highlighted on the left. As a node is entered by selecting one of the child or sibling buttons, a list box will allow the selection of the device (i.e., RF232T, CR10T, etc. ) for that node.
SECTION 5. NETADMIN The DO___RETRIES USING A ____ SEC PERIOD THEN USE ______ SEC. prompts allow the scheduling of fast and slow retries. When an operation (e.g., clock set) fails, it is retried until it succeeds, is canceled by the user, or is canceled by the program that initiated it. This parameter allows the user to control how often these retries occur. The number of retries specified in the first blank are attempted at the interval specified in the second blank.
SECTION 5. NETADMIN Direct Connect (SC32A) − Each remote datalogger is entered as a node (child node of PC1). No other nodes are necessary. Each datalogger (each on its own serial port) has its own polling interval. Phone Modem (DC112) − Enter a node for the phone modem at the computer site (phonebase). Each remote datalogger will be entered as a child node of the phone-base node. Each remote will have its own polling interval with no polling interval for the phone-base. See Section 4.1.
SECTION 5. NETADMIN 5.2 NETWORK HEALTH FIGURE 5-3. Main NetAdmin Screen Showing Network Health When a description is made active, the communications module (DLSMGR) will attempt to establish communication with each new station in the network. The NetAdmin main screen (see Figure 5-3), will show each station entered in the description. The stations will be black until communication is attempted. A green color indicates successful communication, blue indicates a warning occurred, and red indicates a fault.
SECTION 5. NETADMIN FIGURE 5-4. Clock Check/Set View (at 12:00) setting the datalogger clock back to 11:59 will cause an additional 12:00 output to be stored. The datalogger will store correct data based on the number of samples, etc. but two records will have the same time stamp of 12:00. The clock set utility allows the specification of when the clocks are automatically set.
SECTION 5. NETADMIN You can manually force a retry by selecting the KICK button in the CURRENT TRANSACTION box. The STATION box displays the clock set/check currently being worked on. Stations will be retried each time they come to the top of the queue until they succeed or are canceled. The CANCEL PENDING CHECKS can be selected to cancel all remain clock sets/checks. If the AUTOMATICALLY CHECK CLOCKS button is checked, the selected clocks will be checked/set on the defined schedule.
SECTION 5. NETADMIN When all stations that need to have programs downloaded are in the queue, select the START button. The programs will be downloaded one at a time. When a download is complete it will be listed in the .DLD PROGRAM STATUS box at the top of the window. This will replace any earlier message regarding the station. A station and “.DLD” file combination can be removed from the queue by highlighting it and selecting the DELETE button.
SECTION 5. NETADMIN The RF Link Test also returns the signature of the prom in the Remote RF95T. Featuring the RFBASE address in the switch setting box will file the signature of the prom in the RFBASE. 5.6.1 KEYBOARD/DISPLAY 5.6.2 NETADMIN COMMAND LINE PARAMETERS OLETS - Show options for OLETS communication. LT1 - Show options for Level Tech hardware. This option provides CR10KD emulation on the computer. The menu allows the selection of the station to be communicated with. FIGURE 5-6.
SECTION 6. RTM (REAL TIME MONITOR) RTM is used to monitor data values from stations in the RTMS network. RTM offers a variety of data displays including strip charts, bar charts, numerical displays, X/Y plots, etc. Multiple data displays, text, rulers, and drawings (maps) can be combined by the user into a single template (Figure 6-1). Once created, a template can be named and saved for later use. RTM has two modes; Edit and Monitor.
SECTION 6. RTM (REAL TIME MONTIOR) 6.1.2 CREATING A TEMPLATE Creating a template consists of adding the desired displays to the template. Data displays are used to display data retrieved from the dataloggers or to issue control commands to a datalogger. This includes numeric, bar chart, strip chart, X-Y plots, and other displays. Accessory displays are used to enhance data displays and give information about the computer. Accessory displays include rulers (scales), text, and computer date/time.
SECTION 6. RTM (REAL TIME MONITOR) FIGURE 6-2. RTM Screen Showing Station.Table.Field for a Numeric Display To move a display, place the mouse pointer on the display and click the left button. A four-headed arrow will appear. Press and hold the left mouse button and drag the display until it is in the desired location. Clicking on some areas of the display may not show the arrow, for example, the actual strip chart area of the strip chart. Experience will show which areas can be used.
SECTION 6. RTM (REAL TIME MONTIOR) The Station.Table.Field can be selected from a list of those available (see Figure 6-2). This list is displayed by double-clicking in the FIELD IDENTIFIER OR EXPRESSION box or by selecting the DATA TABLE DEF'S button. Selecting a station, table, or field from the list, inserts that definition (as if it had been typed in) at the cursor in the expression box. It does not remove previous selections or entries.
SECTION 6. RTM (REAL TIME MONITOR) 6.1.10 STARTING RTM IN THE MONITOR MODE. RTM normally starts in the edit mode. To have RTM automatically start monitoring a given template, enter the template name along with a /F in the OS/2 setting for RTM. For example, to have RTM start monitoring with a template named LOGAN, the following would be entered in PARAMETER box under the OS/2 settings for RTM: /F LOGAN The .RTM extension is optional.
SECTION 7. DATA COLLECTION (DBSELECT) DBSelect is used to select the data for archival or routing to a different application or a different computer. 7.1 POLLING, HOLE DETECTION, AND HOLE COLLECTION THEORY • If DBSelect is stopped, the data stored while DBSelect is stopped up to the new Data Advise will be a hole. The data collection done by DBSelect consists of two processes; polling and hole collection.
SECTION 7. DATA COLLECTION (DBSELECT) A typical data collection sequence would be: 1. A Data Advise is sent to each station. 2. DLSMGR polls for data at the user entered interval. 3. When data is received DLSMGR sends the data to the module (i.e., DBSelect) that requested the data. 4. If DBSelect detects that the data it received was not the data it expected (i.e., one or more records are missing) a hole collection is started. 5. The polled data is stored in the shadow files or sent through the Named Pipe.
SECTION 7. DATA COLLECTION (DBSELECT) DBSelect VAX,OS/2, HP9000, ... machine OS/2 Machine Ack. Named Pipe TCPC or user TCP program TCPS TCP\IP Network FIGURE 7-1. Example Named Pipe Client Software for TCP/IP Use 7.3.3 ASCII FILES To use ASCII files as the destination, select ASCII FILES... off the FILES submenu (see Figure 7.2). Fill out the parameters as follows: Specify the location (parent directory) for the 'baled' files for the BALE PATH: parameter.
SECTION 7. DATA COLLECTION (DBSELECT) 7.3.6 SELECTING WHAT DATA IS COLLECTED. To select data for collection, select a station (from the station list in the left box) where data collection is desired (see Figure 7-3). Once the station is selected, a list of the tables available from that station is displayed in the middle box. Select the table to be collected. Multiple tables may be selected by holding the CTRL key while clicking on the tables.
SECTION 7. DATA COLLECTION (DBSELECT) FIGURE 7-3. Selection of Data to be Collected 7.4 HOLE COLLECTION STATUS AND MANUAL HOLE COLLECTION Selecting HOLES on the DBSelect main menu displays the hole collection screen, as shown in Figure 7-4. The box at the top shows all holes that are pending including the one currently being worked on. The I WILL WAIT _____ SECONDS FOR A HOLE I HAVE BEEN WAITING _____ SECONDS parameter boxes give information on the current hole collection.
SECTION 7. DATA COLLECTION (DBSELECT) FIGURE 7-4. Hole Collection View hole of the specified range will be inserted into the queue for each station in the network with that table. Selecting one or more entries in the hole queue and selecting the DELETE button will remove the holes from the queue. This will result in missing data if DBSelect added the holes to the queue. DBSelect will periodically check for a file named AUTOHOLE.DAT.
SECTION 8. FILES, PROTOCOLS, AND UTILITIES 8.1 LOG FILES Log files are produced for several reasons. Documenting events that occurred is a primary reason. Logs are also useful as a diagnostic tool. Some of the logs are optional, stored only when enabled. Other logs are always active. Most logs have built-in restrictions that prevent them from consuming all available disk space even if neglected. Most log filenames contain a $ character in the name.
SECTION 8. FILES, PROTOCOLS, AND UTILITIES be able to manually find the missing data in QUEUE.DAT. QUEUE.DAT is not intended to be used as a reliable backup for an intermittent pipe connection. There is no size restriction on QUEUE.DAT but it does not increase in size under normal conditions. 8.1.3 RTM Template.ALM − Where template is the name of the RTM template detecting the user defined alarm. Logging of alarms is optional, as part of the RTM numeric display.
SECTION 8. FILES, PROTOCOLS, AND UTILITIES • • • • • • • • • StationName Space TableName Space Beginning Space End Space Flag. StationName and TableName limited to 8 characters. Space is the ASCII space character. Beginning is the beginning time stamp or record number. End is the ending time stamp or record number. Flag is a 0 or 1. Flag of 0 Indicates beginning and end are Record Numbers. Flag of 1 Indicates beginning and end are time stamps.
SECTION 8. FILES, PROTOCOLS, AND UTILITIES Limitations and issues of concern to the client application include: 1. Each record must be acknowledged before the next record will be sent. 2. Records will occasionally be transferred out of time sequential order. 3. The same record may be transferred multiple times. 4.
SECTION 8. FILES, PROTOCOLS, AND UTILITIES FIGURE 8.5-2. Server State Diagram Key concepts from the state diagrams are shown in the following tables with key words (bold) from the diagrams. CLIENT STATE DIAGRAM: Test For Server Rdy − With Named Pipe and Socket API's, there will usually exist a function used to open the pipe or socket. In this state, the client program should attempt to open the pipe or socket. If Open Failed, the client should wait a while (5 seconds) and try again.
SECTION 8. FILES, PROTOCOLS, AND UTILITIES Send Ack − The send acknowledgment action is done in response to the Record Rdy event, after the record is secured. In Send Ack the client forms an acknowledgment record from information taken from the data record and sends it to the server. Stop − It is important to note that the Stop event could occur at any time. If it occurs while in the Session Open state then the pipe or socket should be closed (Close Session) before program termination.
SECTION 8. FILES, PROTOCOLS, AND UTILITIES Decimal = "DECIMAL(" Digit [ Digit ] "," Digit [ Digit ] ")". VarChar = "VARCHAR(" Digit { Digit } ")". FieldValue = ( TimeStamp | RecordNumber | Number | String ). TimeStamp = "'" Year "-" Month "-" Day " " Hour ":" Minute ":" Second "'". Year = 4( Digit ). Month = 2( Digit ). Day = 2( Digit ). Hour = 2( Digit ). Minute = 2( Digit ). Second = 2( Digit ) [ "." { Digit } ]. RecordNumber = 10{ Digit }. Number = { Digit } [ "." ] { Digit }.
SECTION 8. FILES, PROTOCOLS, AND UTILITIES • TOACI1 indicates the file type and is always present. • RECNBR is the field name for the record number field and is always present. • MD91 is the user specified station name. • • Min2 is the user specified table name. Battery_V -to- Pot are the user specified field names for each of the fields. • TMPSTAMP is the field name for the time stamp field and is always present. NOTE: The text names (labels) are quoted as is the time stamp field.
APPENDIX A. TROUBLESHOOTING THE RTMS NETWORKS A.1 STATION TEST The best tool for determining network status is NetAdmin. Examine the network health screen (main NetAdmin screen). Is each station shown on the NetAdmin network health screen? Stations must be part of the Net Description if data is to be collected. If not, there are two things to check: • Check if Terminal Mode or a clock check with the datalogger works.
APPENDIX A. TROUBLESHOOTING A.2 COMMUNICATION PROBLEMS The approach taken here is to isolate where communication is having difficulty and then attempt to remedy the problem. There is a section for each type of communication link. Keep in mind that DlsMgr will attempt to communicate with a datalogger when it has a reason to do so. The most common reason is to poll the datalogger for data. Other reasons include checking the clock, terminal mode, etc.
APPENDIX A. TROUBLESHOOTING cable. A straight through 9-pin cable connects the SC32A to the datalogger. • With RAD modems and the SC932, verify the switch and jumper setting with those given in the manual. • Do a continuity test on the cable used between the RAD modems. • Do a loop back test to verify each RAD modem. • Does the hand-held keyboard display work? If so, the datalogger has power and should respond. • Does the datalogger have power? Check the 12 Volt supply with a volt meter. A2.
APPENDIX A. TROUBLESHOOTING remote site answering and then a high pitch tone, then the phone line is probably fine. • If the modem dials but the remote site does not answer, the SWF$ messages will be the same as those given previously. First, ensure that the correct number is being called. Check the Net Description for the remote site. If the remote just rings and never answers, check the following: • • Does the datalogger and DC112 have power? Check 12 Volt supply for the datalogger.
APPENDIX A. TROUBLESHOOTING Things to check include: • Ensure that the correct COM port is selected in the Net Description for the Base MD9. Note that when the link does not work several warnings precede a fault. This pattern repeats each time the computer attempts communication with the remote MD9 site. Things to check include: • Is the SC532 is powered up, i.e., plugged in? • Check each cable to be sure it is connected properly.
APPENDIX A. TROUBLESHOOTING '08-24-94 14:26:00','W','PC1','RF2Base','SerLine timeout retry on: COM1.' A2.4 RADIO (RF) This section deals with troubleshooting radio network from the software perspective. It does not give specifics on radio transmission problems regarding antennas, etc. Information on these can be found in the RF Telemetry manual. '08-24-94 14:26:01','W','PC1','RF2Base','SerLine timeout retry on: COM1.' '08-24-94 14:26:02','W','PC1','RF2Base','SerLine timeout retry on: COM1.
APPENDIX A. TROUBLESHOOTING response to transmissions the radio hears. If the frequency is in use, turn off the radio and repeat the power up test. With successful communication to the base RF232T, the remotes should be verified. The best tool for verifying RF communication with a remote is the RF LINK TEST found in NetAdmin. Section 2.4 of the RF Telemetry manual gives information on using this test. Section 4.2.2 of the RF Telemetry manual describes the RF LINK TEST using the DOS-based GT program.
APPENDIX A. TROUBLESHOOTING '08-18-94 15:30:00','S','PC1','PC1', 'Transaction was canceled by client.' '08-18-94 15:30:00','S','PC1','PC1', 'DBSELECT Begin Pipe Queue dump to C:\RTMS\DATA\QUEUE.DAT' and will need to be updated to solve this problem. Table names like T01 indicate that the datalogger has no data labels in the program. This can result from using a keyboard display to program the datalogger.
APPENDIX A. TROUBLESHOOTING '08-18-94 15:21:42','W','PC1','PC1','RTM: StripChart, Data TimeStamp greater than System Time' The datalogger and/or computer clock should be checked. If the RTM and DBSelect selection are correct and match the data available from the datalogger, and RTM, DBSelect, or both are running, then there may be communication problem between DlsMgr and DBSelect or RTM. This may be caused by insufficient computer resources or running to many programs on the OS/2 computer. See Section 2.
APPENDIX A. TROUBLESHOOTING First message indicates the RTM or DBSelect requested a specific range of data using hole collection. Second message indicates what data was collected using hole collection. Several hole collections may be required to collect a single hole depending on the amount of data. Normally these messages can occur following Data Advise messages (see next message) or when holes are manually entered in DBSelect. See Section 7 in RTMS manual.
APPENDIX A. TROUBLESHOOTING set/checked automatically (must be enabled) or manually. Second message is from the datalogger indicating its clock was changed but that no program is running, i.e., no program (.DLD file) has been downloaded. Third message, also from the datalogger, indicates its clock was changed and there is a program running. There is no response generated when the clock is checked. Clock changes are logged in CLKSET$.LOG files. See Section 8 in the RTMS manual.
APPENDIX A. TROUBLESHOOTING or device, DlsMgr may be attempting communication with the wrong device. The third can indicate that DlsMgr is retrying operations before the previous one completes. This usually indicates that the retry periods specified in the Net Description are too short. Otherwise, operations are taking longer than the should and there may be other communication problems. A.4.
APPENDIX A. TROUBLESHOOTING the files contained there at all. The second error indicates the DBSelect could remove a file from the shadow directory after it baled it. DBSelect needs full rights to the SHADOW directory and the data directory. '08-18-94 15:26:50','S','PC1','PC1', 'DBSELECT Stopped' DBSelect has stopped. The program is running but no data is being collected. See Section A3 above and Section 7 of the RTMS manual for more information.
GLOSSARY Acknowledged Named Pipe − See Named Pipe. Exchange of data through a named pipe where the program or process (client) receiving data must acknowledge each record of data it receives. Coaxial cable − Special type of cable with two conductors (center conductor and outer shield conductor). Classified by size, impedance, and loss characteristics. Used to connect MD9 modems and to connect radios to antennas. Advise − See Data Advise COM Port − RS-232 Serial port, i.e., COM1, COM2, etc.
Hole − See hole collection. Because of the way current and older datalogger data are collected simultaneously, there can be sequences of older data that are available from the datalogger but have not yet been collected. DBSelect tracks and optionally collects these holes Hole Collection − See Hole. Process used to collect a specific range of data from a datalogger. Usually used to collect data to fill RTM strip charts or to collect data not collected with Data Advise.
Repeater − A radio (RF) site that relays packets of information to a remote site. Used to extend the range of radio transmissions. Any remote datalogger site with radio can act as a repeater. Retries − When a transaction or communication between two devices or programs fail. The transaction or communication is usually repeated until it succeeds. These “retries” occur based on user entered parameters (in Net Description). RF − Dealing with radio telemetry. Stands for Radio Frequency.