GAMUT Monitoring Quality Assurance and Quality Control Plan Version 1.2 May 16, 2014 Developed by: Amber Spackman Jones, Chris Cox, Joe Crawford, Dave Eiriksson, Jeffery S.
i. Preface iUTAH (innovative Urban Transitions and Aridregion Hydrosustainability) has instrumented three Utah watersheds with environmental monitoring equipment in an effort to observe eco-‐hydrology of mountain to urban gradients.
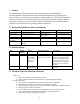
. Quality Control a. QC levels and process to achieve each b. Specific procedures for interpolation and smoothing c. Determination of rules for automated flagging d. Identification of flags implemented to qualify data e. QC workflow (i.e., what to flag, what to edit) 4. Appendix a. Better documentation of site specific details including photos b.
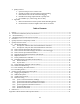
A.1 Red Butte Creek ..................................................................................................................................................... 21 A.2 Logan River .............................................................................................................................................................. 26 A.3 Provo River ..................................................................................................
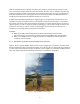
1 Overview iUTAH (innovative Urban Transitions and Aridregion Hydrosustainability) has established monitoring networks in three watersheds in northern Utah: the Logan River, the Provo River, and Red Butte Creek.
small local climatic features. To this end, efforts were made to position climate stations in open areas and aquatic stations within the main channel flow. However, due to utilization of previously installed equipment, permit requirements, and/or budget constraints, there are some deviations from these standards across sites (Appendix A).
Table 1.
Table 2.
3.2 Data Curation: Datalogger Files/Programs 3.3 Data Curation: Data Processing by the Sensor or the Datalogger Datalogger programs have been standardized between sites and across the three GAMUT watersheds to the maximum extent possible to ensure that the code and methods used to generate data are consistent.
well as signal processing theory (Brock et al. 2001, WMO 2010). A casual comparison between projects similar to the GAMUT network (Little Bear River Research Watershed, USU Climate Network) reveals that there is little standardization of sampling rate and averaging methods, which appear to be somewhat arbitrary and based on researcher experience.
is modified when changes are made to datalogger programs as specified by the workflow in Appendix B so as to maintain continuity in and availability of the data. ODM databases house the raw data collected at GAMUT sites as well as higher level data products generated in post processing.
Table 3.
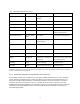
Table 4. Climate/Aquatic Station Sensor Recommended Factory Service Sensor Variable Recommended Factory Service Notes FTS DTS-‐12 Turbidity NTU 1 year $500/sensor YSI EXO pH Head pH 1 Year $170/sensor Replace when the sensor no longer gives reliable data.
ACTIONS: ● Watershed Technicians will observe sensors and data to help determine whether factory maintenance should be performed according to the recommended schedule. Decisions will be made in consultation with the GAMUT research leads.
3.8.1.1 Snow Removal During the winter, there will periodically be the need to clear the solar panels and radiometers of snow. This should be detectable by monitoring the weather, station power, and incoming shortwave radiation measurements and should be performed as soon as is practical following storm events.
● site (Section 3.8.2.7). For all site visits, field notes should be completed and information about the visit then transferred to the Equipment Management website. Details regarding what should be included in aquatic station field notes are included in Appendix D. 3.8.2.
discharge data. This will be accomplished in subsequent versions of this document. Initially, measurements will be conducted at all sites following the methods presented in Turnipseed and Sauer (2010). Water surface elevations and stage plate locations will also be surveyed concurrently with discharge.
The monitoring log is not yet standardized, but whatever system is used should have the following characteristics (See example in Appendix G): ● QA/QC notes: Document any issues related to QA/QC. This could include increased drift or noise, changes in offsets, or unusual spikes. These notes will be used later for flagging or QC operations.
3.11 Data Checking: Automated Alerts In order to identify potential issues in data streams occurring between regular visual checks of the data and to eventually reduce the required frequency of visual checks, the CI Team has deployed automated alerts.
After the implementation of QA and based on the results of QC, there may be data that need to be adjusted (e.g., in the case of drift corrections) or even removed from the quality controlled data record. This will be performed in post processing, as may be the derivation of new data products from the raw data.
ACTIONS: ● The CI Team will work on the implementation of automated flagging. ● The Watershed Technicians will determine the rules to guide automated flagging. ● The Watershed Technicians will compile a list of qualifiers to be used for flagging data. 4.2 ODM Tools Python 4.3 Quality Control Levels ODM Tools Python (https://github.
● ● Quality control level 2: Derived products that require scientific and technical interpretation and may include multiple-‐sensor data (e.g., discharge derived from stage, basin-‐average precipitation derived from multiple rain gages). Quality control level 3+: Higher level data products involving analysis and interpretation. 4.
question due to sensor malfunction or environmental conditions (e.g., DO sensor buried in sediment, soil moisture sensor affected by lightning).
5 References Brock, F. V. and Richardson, S.J., 2001. Meteorological measurement systems. Vol. 86. Oxford: Oxford University Press. Campbell, J.L., Rustad, L.E., Porter, J.H., Taylor, J.R., Ethan, W., Shanley, J.B., Gries, C., Henshaw, D.L., Martin, M.E., Wade, M., Boose, E.R., Dereszynski, E.W., 2013. Quantity is Nothing without Quality.
Appendix A: Watershed and Site Specific Details A.1 Red Butte Creek Site Name: Foothill Drive Advanced Aquatic Site Abbreviation: RB_FD_AA Lat/Long: 40.757225°, -‐111.833722° Deviations from Table 2 sensor list: None General comments: This site is somewhat difficult to access due to a steep bank.
Site Name: Cottams Grove Basic Aquatic Site Abbreviation: RB_CG_BA Lat/Long: 40.763958°, -‐111.828286° Deviations from Table 2 sensor list: None General comments: Photo: Site Name: Red Butte Gate Basic Aquatic Site Abbreviation: RB_RBG_BA Lat/Long: 40.774050°,-‐111.
Site Name: Above Red Butte Reservoir Advanced Aquatic Site Abbreviation: RB_ARBR_AA Lat/Long: 40.779602°,-‐111.806669° Deviations from Table 2 sensor list: No pressure transducer at this site because of close proximity of USGS stream gauge.
Site Name: Green Infrastructure Research Facility (GIRF) Climate Site Abbreviation: RB_GIRF_C Lat/Long: 40.760800°,-‐111.830474° Deviations from Table 3 sensor list: None General comments: Photo: Site Name: Above Red Butte Reservoir Climate Site Abbreviation: RB_ARBR_C Lat/Long: 40.780567°, -‐111.
Site Name: Todd’s Meadow Climate Site Abbreviation: RB_TM_C Lat/Long: 40.789054°,-‐111.796416° Deviations from Table 3 sensor list: This site includes an additional 9 soil moisture sensors and 9 soil oxygen sensors installed near the surface, just north of the climate tower. These were installed in October, 2013 to support research by Dr.
A.2 Logan River Site Name: TWDEF Climate Site Abbreviation: L_TD_C Lat/Long: 41.864805°, -‐111.507494° Deviations from Table 3 sensor list: None Site Name: Franklin Basin Climate Site Abbreviation: L_FB_C Lat/Long: 41.949815, -‐111.
Site Name: Mendon Road Advanced Aquatic Site Abbreviation: L_MR_AA Lat/Long: 41.720633, -‐111.886478 Deviations from Table 3 sensor list: None A.3 Provo River Site Name: Provo River Below Jordanelle Reservoir Aquatic Site Abbreviation: PR_BJ_AA Lat/Long: 40.59507, -‐111.
Appendix B: Protocols for Updating Datalogger Programs Scenario 1: Update is planned out and is less time sensitive (e.g., addition/deletion of long term variable, additional tables being created because of adaptive sampling, etc.) NOTE: Data for 1-‐2 time steps may be lost during this process. 1.
5. Technician downloads any data resulting from the diagnostic program to his/her laptop at the end of troubleshooting activities if it needs to be saved. 6. When the troubleshooting/diagnostic program is terminated, the previous program (or a new program version) is loaded back onto the datalogger by the technician for normal operations. 7.
Appendix C: Measurement Plans Table C-‐1. Baseline Aquatic Site Measurement Plan: *These variables are only measured at advanced aquatic sites. **Every 15 minutes, 25 measurements are made within about 20 seconds. The result is the average of the burst sample.
Table C-‐2. Baseline Climate Site Measurement Plan: * Measurements made every 10 seconds during the final minute of the 15-‐min interval. The result is the average of the final 6 measurements. ** Measurements made every 10 seconds during the final minute of the 15-‐min interval.
Appendix D: Site Visit Checklist and Field Sheet Climate Field notes can be kept by individual technicians as they see fit. Regardless of the format, notes should contain the following information at a minimum.
Site Visit Checklist Location: Date/Time: Crew Members: Environmental Observations: Field Activities and Times: Stage Reading (Aquatic Stations Only) and Time: Notes: Calibration Checklist Time sensor was pulled/removed: Setpoint/Pre/Post values for each standard: Temperature of fluorescent solutions used
Appendix E: Calibration/Maintenance Detailed Instructions E.1 Regular Geonor Precipitation Gage Maintenance 1. Connect to datalogger and record the most recent cumulative precipitation value. 2. Remove gage cover. 3. Empty the antifreeze/water/oil solution if necessary. 600 mm gages should be emptied when the bucket contains ~450-‐500 mm of liquid.
E.3 EXO2 Sonde Calibration E.3.1 Basic Calibration All EXO sensors (except the temperature sensor) will periodically need to be calibrated. Multiple sensors of the same type can be calibrated concurrently by installing sensors of the same type on one sonde. Note that calibrations occur one after the other, not simultaneously.
12. Click ‘Exit’. 13. Rinse the sonde and sensor in tap or purified water and dry. E.3.3 Dissolved Oxygen 1. 2. 3. 4. 5. 6. 7. 8. 9. Fill up large bucket/pot with water from the river in which the sonde will be deployed. Turn on air pump to sparge the water. Insert sonde into the water.
19. Click ‘Proceed’ in the pop-‐up window. 20. Wait until readings under ‘Current and Pending Data Points’ are stable (for approximately 40 seconds). 21. Click ‘Apply’ to accept the calibration. 22. Rinse the sonde and calibration cup in water. 23. Repeat Steps 15-‐21 for pH 10. 24. Click ‘Complete’. 25. Click ‘Exit. 26.
16. While the readings are stabilizing, click the ‘Wipe Sensors’ button to activate the wiper to remove any bubbles. 17. Wait until readings are stable (about 40 seconds). 18. Click ‘Apply’ to accept calibration. 19. Click ‘Complete’. 20. Click ‘Exit’. 21. Rinse the sonde and sensor in tap or purified water and dry.
Table E-‐2. Effect of temperature on quinine sulfate fluorescence. 1. 2. 3. 4. 5. 6. 7. 8. 9. 10. 11. 12. 13. 14. 15. 16. 17. 18. 19. Rinse the calibration cup with deionized or distilled water Pour the correct amount of clear deionized or distilled water into the calibration cup. Immerse the probe end of the sonde in the water.
E.5 Preparation of Calibration Solutions E.5.1 Quinine Sulfate Solution for fDOM Sensor Use the following procedure to prepare a 300 μg/L solution of quinine sulfate (300 QSU) that can be used to calibrate the EXO fDOM sensor for field use. 1. Weigh 0.
Appendix F: Chemical Disposal To ensure safe handling of chemicals and solutions, the watershed technicians have MSDS for all chemicals. All hazardous materials and waste used in the field or the lab will be disposed of properly according to federal regulations, as described below.
When the hazardous waste containers are full, a “Hazardous Waste Pickup" form should be completed and submitted to the appropriate University Environmental Management or Environmental Health and Safety department, listed in Table F-‐2. Table F-‐2. Chemical waste pickup forms at each University.
Appendix G: Station Problem Log Template Example Monitoring Log: 2/7/2014 TWDEF ● QC – Weird spikes in humidity on 2/6 – 2/7.