TGA100A Trace Gas Analyzer Overview The TGA100A Trace Gas Analyzer measures trace gas concentration in an air sample using tunable diode laser absorption spectroscopy (TDLAS). This technique provides high sensitivity, speed, and selectivity. The TGA100A is a rugged, portable instrument designed for use in the field. Common applications include gradient or eddy covariance flux measurements of methane or nitrous oxide and isotope ratio measurements of carbon dioxide or water vapor.
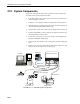
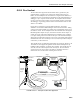
TGA100A Trace Gas Analyzer Overview OV1. System Components Figure OV1-1 illustrates the main system components needed to operate the TGA100A. These system components include: • TGA100A Analyzer: The analyzer optics and electronics, mounted in an insulated fiberglass enclosure. • Computer: A user-supplied computer to display data and set parameters. • Optional Datalogger (CR5000 shown): Receives concentration data from the TGA100A through the SDM interface cable.
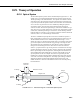
TGA100A Trace Gas Analyzer Overview OV2. Theory of Operation OV2.1 Optical System The TGA100A optical system is shown schematically in Figure OV2.1-1. The optical source is a lead-salt tunable diode laser that operates between 80 and 140 K, depending on the individual laser. Two options are available to mount and cool the laser: the TGA100A LN2 Laser Dewar and the TGA100A Laser Cryocooler System.
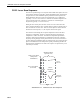
TGA100A Trace Gas Analyzer Overview OV2.2 Laser Scan Sequence The laser is operated using a scan sequence that includes three phases: the zero current phase, the high current phase, and the modulation phase, as illustrated in Figure OV2.2-1. The modulation phase performs the actual spectral scan. During this phase the laser current is increased linearly over a small range (typically +/- 0.5 to 1 mA). The laser’s emission wavenumber depends on its current.
TGA100A Trace Gas Analyzer Overview OV2.3 Concentration Calculation The reference and sample detector signals are digitized at 50 kHz (100 samples per scan), corrected for detector offset and nonlinearity, and converted to absorbance. A linear regression of sample absorbance vs. reference absorbance gives their ratio. The assumption that temperature and pressure are the same for the sample and reference gases is fundamental to the design of the TGA100A.
TGA100A Trace Gas Analyzer Overview OV4. Multiple Scan Mode The TGA100A can be configured to measure two or three gases simultaneously by alternating the spectral scan wavelength between two or three absorption lines. This technique requires that the absorption lines be close together (within about 1 cm-1), so it can be used only in very specific cases.
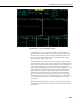
TGA100A Trace Gas Analyzer Overview FIGURE OV5-1. Real Time Graphics Screen In the middle of the screen are graph 1 and graph 2, used to display userselectable variables. This example shows N2O concentration in graph 1 and laser temperature in graph 2. Graph 3 is located at the bottom-center of the screen, and is also used to display user-selected variables. In this example graph 3 shows the sample cell pressure.
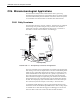
TGA100A Trace Gas Analyzer Overview OV6. Micrometeorological Applications The TGA100A is ideally suited to measure fluxes of trace gases using micrometeorological techniques. Its rugged design allows it to operate reliably in the field with minimal protection from the environment, and it incorporates several hardware and software features to facilitate these measurements. OV6.
TGA100A Trace Gas Analyzer Overview OV6.2 Flux Gradient The TGA100A also supports the measurement of trace gas fluxes by the gradient method. A gradient valve switches the sample between the two intakes, the valid samples from each intake are averaged and the difference is computed. The valve control and the calculations can be performed either by a datalogger or by a computer and I/O module. The computer and I/O module provide a convenient user interface, but require shelter from the environment.
TGA100A Trace Gas Analyzer Overview OV6.3 Site Means Sampling Mode The TGA100A’s site means mode is similar to the flux gradient mode in that it controls switching valves and calculates mean concentrations for each intake. The difference between the two sampling modes is that the gradient mode considers the sample intakes in pairs, switching several times between an upper and lower intake before moving to another site, but the site means mode considers all of the intakes as one group.
TGA100A Trace Gas Analyzer Overview OV6.4 Absolute Concentration / Isotope Ratio Measurements The TGA100A can be configured for highly accurate measurements of trace gas concentrations by performing frequent calibration. The TGA100A has a small offset error caused by optical interference. This offset error changes slowly over time, with a standard deviation roughly equal to the short-term noise.
TGA100A Trace Gas Analyzer Overview OV7. Specifications OV7.1 Measurement Specifications The preliminary frequency response and noise specifications given in this section are based on performance of the TGA100, which has a 10 Hz update rate. The TGA100A has a faster update rate, which should give improved performance. The frequency response is determined by the time required to flush the sample cell (480 ml volume). The frequency response was measured at 14.4 slpm flow rate and 50 mbar sample pressure (4.
TGA100A Trace Gas Analyzer Overview The TGA100A multiple-scan mode can be used to measure suitable pairs of gases. Typical performance for some examples is given in Table OV7.1-2. TABLE OV7.1-2. Typical Concentration Measurement Noise Gas Nitrous Oxide and Methane Nitrous Oxide and Carbon Monoxide Nitrous Oxide and Carbon Dioxide N2O CH4 N2O CO N2O CO N2O CO2 Wave number 10 Hz Noise 30-min Gradient (ppbv) Resolution (pptv) (cm-1) 1271.077 7 140 1270.785 18 360 2190.350 5 100 2190.018 5 100 2203.733 1.
TGA100A Trace Gas Analyzer Overview OV7.2 Physical Specifications Analyzer Length: Width: Height: Weight: 211 cm (83 in) 47 cm (18.5 in) 55 cm (21.5 in) 74.