TDR100 Revision: 2/10 C o p y r i g h t © 2 0 0 0 - 2 0 1 0 C a m p b e l l S c i e n t i f i c , I n c .
Warranty and Assistance The TDR100 is warranted by CAMPBELL SCIENTIFIC, INC. to be free from defects in materials and workmanship under normal use and service for twelve (12) months from date of shipment unless specified otherwise. Batteries have no warranty. CAMPBELL SCIENTIFIC, INC.'s obligation under this warranty is limited to repairing or replacing (at CAMPBELL SCIENTIFIC, INC.'s option) defective products.
TDR100 Table of Contents PDF viewers note: These page numbers refer to the printed version of this document. Use the Adobe Acrobat® bookmarks tab for links to specific sections. 1. Introduction..................................................................1 1.1 TDR100 Packing List ...............................................................................1 1.2 ENCTDR100 Packing List .......................................................................1 2. System Specifications....................
TDR100 Table of Contents 5.8 Soil Probes ............................................................................................. 17 5.8.1 Determining Probe Constant, Kp, using PCTDR......................... 18 6. Datalogger Instructions for TDR Measurements ....18 6.1 CR800, CR850, CR1000, or CR3000 Datalogger Instruction “TDR100”18 6.2 CR10X and CR23X Datalogger Instruction 119 ................................... 20 6.3 Discussion of TDR Instruction Parameters (Instruction 119)................
TDR100 Table of Contents 11. References ...............................................................51 Figures 3-1 Waveform of a CS610 in water................................................................5 3-2 Waveform of CS610 in water after changing Start and Length parameters to display relevant portion of reflected signal......................................6 4-1 PCTDR waveform for CS610 in water ..................................................10 5-1 TDR System Components .....................
TDR100 Table of Contents iv
TDR100 1. Introduction This document presents operating instructions for the TDR100 and associated equipment and discusses time domain reflectometry (TDR) principles. Section 3 (Getting Started with TDR100 using PCTDR) describes a simple start-up configuration to quickly and easily display TDR probe waveforms using PCTDR. See the “TDR Probes” manual for detailed information about TDR probes available from Campbell Scientific. Manuals can be downloaded from our website: www.campbellsci.com/manuals.
TDR100 2. System Specifications 2.1 General See the CR10X, CR23X, CR800/CR850, CR1000, or CR3000 datalogger manuals for datalogger specifications. 2.2 Power Consumption 2.2.1 TDR100 • The current demand for the TDR100 during measurement is 270 milliamps. • When the TDR100 is controlled by a datalogger, a 35 second timer puts the device in sleep mode requiring about 20 milliamps. After 35 seconds in sleep mode, a timer puts the TDR100 in standby mode requiring about 2 milliamps.
TDR100 waveform averaging 1 to 128 electrostatic discharge protection internal clamping power supply unregulated 12 volt (9.6 V to 16 V), 300 milliamps maximum temperature range -40°C to 55°C dimensions 210mm x 110mm x 55 mm weight 700 g 2.4. Electromagnetic Compatibility The TDR100 is Œ compliant with performance criteria available upon request. RF emissions are below EN55022 limit.
TDR100 port 1 is the default setting and can be changed in PCTDR menu Settings/Communications. The baud rate is factory set to 57600. 3. Connect 12 volt power to TDR100 12 volt power to the TDR100 is connected using terminals +12V and GROUND on the panel 5-terminal connector. An external power supply or the 12V terminals of a datalogger can be used for power. The C1, C2 and C3 terminals are for SDM (synchronous device for measurement communication protocol) communications.
TDR100 FIGURE 3-1. Waveform of a CS610 in water. Changing the Waveform Start value to 5.7 m and the Waveform Length to 5 m gives the waveform displayed in Figure 3-2.
TDR100 FIGURE 3-2. Waveform of CS610 in water after changing Start and Length parameters to display relevant portion of reflected signal. 3.2 PCTDR Help Information on PCTDR is available from the HELP menu or by pressing F1. Using F1 gives specific help associated with the position of the cursor or active screen. See Section 4.2 for PCTDR HELP details. 4.
TDR100 Note for use of PCTDR when TDR100 is connected to CR23X or CR1000 datalogger When the TDR100 is connected to a CR23X or CR1000 datalogger using control ports 1-3 for SDM control and SDMX50 multiplexers are also connected, an instruction must be used in the datalogger program to properly configure the control ports. If this is not done, PCTDR will not control the multiplexers.
TDR100 4.3 Menu Selections 4.3.1 File Menu Save Configuration/Load Configuration - save and reload configuration of user-selectable parameters. Saves configuration as .wfd file. Save ASCII Waveform - save displayed waveform as .dat file. Save Mux Setup/Load Mux Setup - save and reload multiplexer setup. Saves as .mux file. Print Graph - send displayed graph to default printer Exit - quit PCTDR 4.3.
TDR100 4.4.2 Waveform Average - sets the number of measurements averaged at a given distance from the TDR100. A value of 4 is recommended. Higher values can be used when noise is present. Averaging is useful when noise from power sources or when noise of random nature is superimposed on the reflection waveform. Averaging is accomplished by collecting n values at a given distance before collecting values at the next distance increment where n is the value entered in Average.
TDR100 FIGURE 4-1. PCTDR waveform for CS610 in water. The algorithm will use the length of the waveform set by the Waveform Length. After finding the probe beginning, the algorithm searches over the remaining waveform for the end of the probe. The length must be large enough to display a short distance past the end of the probe under the wettest expected conditions. TABLE 4-1. Recommended Waveform Length values for range of TDR probe rod lengths assuming soil porosity of 0.60. Probe rod length (m) 0.
TDR100 Lw = . ) L ⋅ (θv − max + 0176 0114 . +2 with L the actual probe rod length, and, θv-max the maximum expected volumetric water content. Two m is added for the .5 m before the probe and some distance after the probe end. For example, using a CS610 with 0.3 m probe rod length in a soil with a porosity of 0.6 gives an estimated apparent probe length of 4.04 m. Setting the Waveform Length to 4 m is recommended. 5. System Components: Datalogger Control 5.1 General Datalogger FIGURE 5-1.
TDR100 5.3 TDR100 The TDR100 contains the pulse generator for the signal applied to a TDR probe. The TDR100 also digitizes the reflection and applies numerical algorithms for measuring volumetric water content or electrical conductivity. The TDR100 communicates with the datalogger using SDM protocol or with a computer using PCTDR and serial communications. 5.4 SDMX50 The SDMX50 is a 50 ohm, eight-to-one, coaxial multiplexer.
TDR100 5.5 Power Supply The system operates on 12 V power. A user supplied deep cycle 12 V lead acid battery is commonly used in remote installations. Two terminal strip adapters for the battery posts are provided with the ENCTDR100 (see Figure 5-3). These terminal strips will mount to wing nut battery posts found on most deep cycle lead acid batteries. Installations with AC power available should use it to continuously charge the system battery.
TDR100 components in the enclosure. A short run of heavy gage (10 AWG or heavier) wire should be connected from the enclosure lug to earth ground. The ground lug on peripheral SDMX50 multiplexer enclosures should only be used if the multiplexer is close enough to conveniently use the same ground point as the datalogger. 5.6 SDM Communication 5.6.
TDR100 FIGURE 5-4. Location of Address Jumpers on SDMX50 TABLE 5-1.
TDR100 5.6.2 SDM Cable and Cable Length Considerations A 5-conductor cable with shield and drain is used for interconnection of SDM devices. The 5 conductors are used for 12 volt power, ground and the 3 SDM lines. A cable assembly (pn13776) is provided with the TDR100 and the ENCTDR100. This assembly is for SDM connection between the TDR100 and a datalogger and between the TDR100 and a SDMX50 multiplexer.
TDR100 WARNING: PS12 POWER SUPPLY PERMANENT DAMAGE TO RECHARGEABLE CELLS MAY RESULT IF DISCHARGED BELOW 10.5 VOLTS WITH 12V CHARGING REGULATOR ENCTDR100 shown with PS12 power supply, CR10X datalogger, TDR100, and SDMX50SP coaxial multiplexer.
TDR100 Campbell Scientific TDR Probes General Description Dimensions Cable type Cable length Probe offset factor Probe constant for electrical conductivity (Kp) *see Section 5.8.1 CS605 3-rod probe no balun required stainless steel rods Rods: 30 cm length 0.476 cm diameter Probe head: cable-to-rod 10.8 cm width 7.0 cm thickness 1.9 cm RG58 user-specified length 0.085 m 1.74 CS610 3-rod probe no balun required stainless steel rods Rods: 30 cm length 0.476 cm diameter Probe head: cable-to-rod 10.
TDR100 SDMAddress: The SDMAddress parameter defines the address of the TDR100 with which to communicate. Valid SDM addresses are 0 through 14. Address 15 is reserved for the SDMTrigger instruction. If the Reps parameter is greater than 1, the datalogger will increment the SDM address for each subsequent TDR100 that it communicates with. NOTE CRBasic dataloggers use base 10 when addressing SDM devices. Edlog programmed dataloggers (e.g., CR10X, CR23X) used base 4 for addressing.
TDR100 length is used by the analysis algorithm to begin searching for the TDR probe. If a 1 or 2 is entered for the Option parameter, cable length is the distance to the start of the collected waveform. The value used for CableLength is best determined using PCTDR100 with the Vp = 1.0. Adjust the CableLength and WindowLength values in PCTDR100 until the probe reflection can be viewed. Subtract about 0.5 meters from the distance associated with the beginning of the probe reflection.
TDR100 Waveform Averaging 4: FP Vp Points 5: 6: FP FP Cable length (meters) 7: FP Window Length (meters) Probe length 8: 9: FP 1128 .1 - 1 202048 02100 .1 700 4 Probe offset 10: FP Input location 11: 4 Multiplier 12: FP Offset 13: FP 01.0 Number of reflections averaged by the TDR100.
TDR100 6.3.2.2 Enter 1: Collect Waveform The digitized reflection waveform can be collected from the TDR100 by the datalogger in ASCII format. Datalogger input storage must be manually allocated for the waveform data points using “block allocation” in Edlog datalogger software. The waveform is collected as an array. The first 9 cells of the array is a header and contain values entered in Instruction 119. Waveform values fill the rest of the array.
TDR100 8 8 consecutive probes are read; the probes are connected to channels 1, 2, 3, 4, 5, 6, 7, and 8 of the level 1 multiplexer. Example 2 An entry of 3624: Entry Description 3 6 2 4 channel 3 is specified for the level 1 multiplexer. channel 6 is specified for the level 2 multiplexer. channel 2 is specified for the level 3 multiplexer. 4 consecutive probes are read; the probes are connected to channels 2, 3, 4, and 5 of the level 3 multiplexer. 6.3.
TDR100 beginning of the probe can be read from the x-axis. Subtract 0.5 meters from the beginning distance and use that value in parameter 7 of datalogger instruction 119. It is important that the Vp used during determination of value for cable length be the same Vp used during subsequent measurements with PCTDR and datalogger instruction 119. A Vp value of 1.0 is recommended for soil water measurements. 6.3.
TDR100 TABLE 6-1. Reflection waveform array header elements. Description of Array Header Elements 1 averaging 2 propagation velocity 3 number of data points 4 cable length 5 window length 6 probe rod length 7 probe offset 8 multiplier 9 offset 6.3.12 Parameter 12: Multiplier Multiplication factor applied to the value stored in the input location specified in parameter 11. Set to 1 when parameter 2 is 1 or 2.
TDR100 The probe constant (Kp) is easily determined using PCTDR or can be determined through calibration. The probe rods are immersed in solutions of known electrical conductivity and values of 1 1− ρ collected by the Zc 1 + ρ datalogger. A linear regression of known electrical conductivity to the result from the datalogger will have a slope equal to the probe constant.
TDR100 The relationship between dielectric constant and volumetric water content has been described by, among others, Topp et al. (1980) and Ledieu et al. (1986) in an empirical fashion using both polynomial and linear forms. These expressions are presented here since it has been shown in numerous research efforts that these equations are appropriate for nearly all applications. With θv the volumetric water content, the equation presented by Topp et al. (1980) is θ v = −5.3∗10 −2 + 2.92∗10 −2 K a − 55 .
TDR100 8. Cable Length and Soil Electrical Conductivity Effect on Water Content Determination 8.1 Cable Length Effect on Water Content Measurement The determination of water content using the TDR system relies on the evaluation of a pulse reflection from the TDR probe. The pulse generated by the TDR100 and its reflections are subject to distortion during travel between the TDR100 and the TDR probe.
TDR100 cable lengths will be maintained as long as soil electrical conductivity does not prevent a reflection from the end of the probe rods. This is discussed later in this section. Minimizing cable lengths should always be considered in the design of a measurement system using TDR. If long cable lengths are necessary, the adverse effects can be minimized by using low attenuation cable such as RG8. Careful probe design ensures correct probe impedance giving robust reflections.
TDR100 water content = 18% water content = 37% FIGURE 8-3. Waveforms collected in a sandy loam using CS610 probe with RG8 connecting cable. Volumetric water content values are 10, 18, 26, 30 and 37%. Solution electrical conductivity is 10.2 dS m-1. The combined effect of long cable runs and high soil electrical conductivity must be considered when TDR measurements are taken. 9. Algorithm Description and Parameter Adjustment 9.
TDR100 9.2.1.1 Waveform Evaluation Figure 9-1 shows a typical waveform and identifies key points. The waveform before point 1 is the section of coaxial cable near the probe head with point 1 the transition from the 50 ohms of the cable to the impedance of the probe. The change in reflection coefficient between points 1 and 2 is related to the difference in impedance between the cable and the probe. Point 2 corresponds to the rods exiting the probe head and point 3 is the end of the probe rods.
TDR100 9.2.2 Algorithm Parameter Adjustment for Special Conditions The standard settings for the apparent length algorithm work well for nearly all applications. For special cases of very long cables or some probes that are not manufactured by Campbell Scientific an algorithm parameter change can improve results. The parameter discussed here affects how the algorithm finds the beginning of the TDR probe. 9.2.2.
TDR100 9.3 Algorithm for Calculation of Bulk Electrical Conductivity 9.3.1 Algorithm Description Section 7, TDR Principles, presents the equation and method used by the TDR100 to calculate bulk electrical conductivity. The electrical conductivity calculation uses waveform values for the region immediately before the TDR probe and values from about 200 meters from the TDR100.
TDR100 To view the current parameter values type GECP at the > prompt. The values of the 4 parameters are returned. The default values for the threshold equation are: a=0 b=1 c=2 Therefore the default threshold is the mean plus twice the standard deviation of the values in the 10-point window before the probe. All values in the window must be below the threshold value. The threshold equation was chosen to provide flexibility when conditions of noise or large amount of signal attenuation are present.
TDR100 10. Programming Examples 10.
TDR100 'CR1000 Series Datalogger 'program: c:\mydoc\cr1000\cr1000-testing\TDR&SDM&F1&Wave_CR1K.CR1 'date: 10-27-04 'Measure and Record Analog Measurements, Volumetric Water Content, & Store Waveforms ' 'Declare Public & Dim Variables -----------------------------------Public batt_volt Public Panel_temp Public LaL(8) Public LaL2(8) Public LedieuVWC(8) Public ToppVWC(8) Public Flag(2) Dim WavePT(260) 'To conserve datalogger memory, use Dim instead of Public for waveform data points.
TDR100 'Main Program --------------------------------------------------BeginProg SDMSpeed (50) 'Fix TDR100 to CR1K communication timing ' Scan (5,Sec,0,0) 'scan instructions every 5 sec Battery (Batt_volt) PanelTemp (Panel_temp,250) CallTable Dat15min ' 'Set flag 1 High every 120 minutes (Note: User can manually set flag 1 high/low) If TimeIntoInterval(0,2,Hr) Then Flag(1)=High 'Set flag 2 High once per day (Note: User can manually set flag 2 high/low) If TimeIntoInterval(0,24,Hr) then flag(2)=high ' If Fl
TDR100 ' MuxChan=3001 TDR100 (WavePT(),0,1,3001,4,1.0,251,9.5,5.0,0.3,0.085,1,0) CallTable TDR_Wave() ' MuxChan=4001 TDR100 (WavePT(),0,1,4001,4,1.0,251,9.5,5.0,0.3,0.085,1,0) CallTable TDR_Wave() ' MuxChan=5001 TDR100 (WavePT(),0,1,5001,4,1.0,251,9.5,5.0,0.3,0.085,1,0) CallTable TDR_Wave() ' MuxChan=6001 TDR100 (WavePT(),0,1,6001,4,1.0,251,9.5,5.0,0.3,0.085,1,0) CallTable TDR_Wave() ' MuxChan=7001 TDR100 (WavePT(),0,1,7001,4,1.0,251,9.5,5.0,0.3,0.
TDR100 ;{CR10X} ; ;Program Name = T100EX#1 ; *Table 1 Program 01: 60 Execution Interval (seconds) ;Measure the datalogger power supply voltage: 1: Batt Voltage (P10) 1: 1 Loc [ Bat_Volt ] ;Measure the internal temperature of the datalogger: 2: Internal Temperature (P17) 1: 2 Loc [ DL_Temp ] ;Set port 5 high to switch ON "Switched 12V" power from the datalogger to power the TDR100.
TDR100 ;Output a time stamp; year, day, and hour/minute: 7: Real Time (P77) 1: 1220 Year,Day,Hour/Minute (midnight = 2400) ;Output the minimum Battery Voltage: 8: Minimum (P74) 1: 1 Reps 2: 0 Value Only 3: 1 Loc [ Bat_Volt ] ;Output the average Datalogger temperature and water content 9: Average (P71) 1: 2 Reps 2: 2 Loc [ DL_Temp ] *Table 2 Program 02: 0.
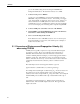
TDR100 1: If Flag/Port (P91) 1: 21 Do if Flag 1 is Low 2: 0 Go to end of Program Table ;Measure the datalogger power supply voltage: 2: Batt Voltage (P10) 1: 1 Loc [ Bat_Volt ] ;Measure the internal temperature of the datalogger: 3: Internal Temperature (P17) 1: 2 Loc [ DL_Temp ] ;Set port 5 high to switch ON "Switched 12V" power from the datalogger to power the TDR100. 4: Do (P86) 1: 45 Set Port 5 High ;Measure the CS610 probe connected to Channel 3 of the level 1 SDMX50 and return La/L.
TDR100 ;Apply Topp's 3rd order polynomial: 8: Polynomial (P55) 1: 1 Reps 2: 4 X Loc [ WC_CH3 ] 3: 4 F(X) Loc [ WC_CH3 ] 4: -0.053 C0 5: .292 C1 6: -0.055 C2 7: 0.0043 C3 8: 0.0 C4 9: 0.0 C5 ;Measure Electrical Conductivity on the same CS610 TDR probe connected to Channel 3. 9: TDR100 Measurement (P119) 1: 0 SDM Address 2: 3 Electrical Conductivity 3: 3001 MMMP Mux & Probe Selection 4: 4 Waveform Averaging 5: 1 Vp 6: 250 Points 7: 9.5 Cable Length (meters) 8: 5 Window Length (meters) 9: .
TDR100 ;Turn off the switched 12V to power off the TDR100: 11: Do (P86) 1: 55 Set Port 5 Low ;Set the Output Flag to output data each time measurements are made: 12: Do (P86) 1: 10 Set Output Flag High (Flag 0) ;Output a time stamp; year, day, and hour/minute: 13: Real Time (P77) 1: 1220 Year,Day,Hour/Minute (midnight = 2400) ;Output the Battery_Voltage, DataLogger Temperature, WaterContent, ;and Electrical Conductivity.
TDR100 Example 3, Measure and Record; Volumetric Water Content and Analog Measurements Eight CS605 or CS610 probes are connected to Channel #1 through #8 of a Level #1 SDMX50 multiplexer. A cable length value of 10 meters was determined using PCTDR. The La/L value is converted to volumetric water content using the Topp calibration. The program is executed every two minutes. The array id, time, volumetric water content and analog measurements are output to Final Storage every two minutes.
TDR100 4: Beginning of Loop (P87) 1: 0 Delay 2: 8 Loop Count ;Square La/L to convert to dielectric constant: ;Note: The user must manually allocate 8 input locations "WC_1" through WC_8". 5: Z=X*Y (P36) 1: 1 2: 1 3: 11 -- X Loc [ LaL_1 -- Y Loc [ LaL_1 -- Z Loc [ WC_1 ] ] ] ;Multiply the dielectric constant by 0.1 to prepare for the 3rd order polynomial ;with the appropriately scaled coefficients for Topp's calibration: 6: Z=X*F (P37) 1: 11 2: 0.
TDR100 *Table 2 Program 02: 0.0000 Execution Interval (seconds) *Table 3 Subroutines End Program Example 4, Measure and Record; Analog Measurements and Volumetric Water Content In this example analog measurements are made every 5 minutes and TDR100 measurements are made every 60 minutes. Twenty-nine CS605 or CS610 probes are connected to 4 SDMX50 multiplexers (Figure 10-1). The cable length values were determined using PCTDR.
TDR100 ;{CR10X} ;Program = T100EX#4 *Table 1 Program 01: 300 Execution Interval (seconds) ;Every 5 minutes (300 second execution interval) ;Measure the datalogger power supply voltage: 1: Batt Voltage (P10) 1: 1 Loc [ Bat_Volt ] ;Measure the internal temperature of the datalogger: 2: Internal Temperature (P17) 1: 2 Loc [ DL_Temp ] ;Once an hour on the hour (0 minutes into a 60 minute interval) ;Measure the TDR probes: 3: If time is (P92) 1: 0 Minutes (Seconds --) into a 2: 60 Interval (same units as above)
TDR100 6: TDR100 Measurement (P119) 1: 00 SDM Address 2: 0 La/L 3: 1108 MMMP Mux & Probe Selection 4: 4 Waveform Averaging 5: 1 Vp 6: 250 Points 7: 9.5 Cable Length (meters) 8: 5 Window Length (meters) 9: .3 Probe Length (meters) 10: .085 Probe Offset (meters) 11: 17 Loc [ WC_1101 ] 12: 1138 Mult 13: -0.
TDR100 ;Turn off the switched 12V to power off the TDR100: 9: Do (P86) 1: 55 Set Port 5 Low ;Now, after making the measurements, set the output flag.
TDR100 FIGURE 10-1. Twenty-nine CS605 or CS610 probes connected to 4ea SDMX50 multiplexers. Example 5, Trouble Shooting Program for SDMX50 Multiplexer, Datalogger Control Ports, and Analog Measurements The following program can be used to test the operation of the SDMX50 Multiplexer and the datalogger control ports. ;{CR10X} ;Program Name: Example 5 *Table 1 Program 01: 5 Execution Interval (seconds) ;The Following Instruction 20 configures all 8 Control Ports as Outputs.
TDR100 ;NOTE: While Flag 1 is high Instruction 109 will take control of the ;SDM ports 1-3. It may not be possible to follow the ports ;going High and low with a voltmeter while this is happening. 2: If Flag/Port (P91) 1: 11 Do if Flag 1 is High 2: 30 Then Do 3: SDMX50 Channel Select (P109) 1: 01 SDM Address 2: 8 SDM Channel ; Enter correct address for connected multiplexer 4: End (P95) ;End, If Flag 1 *Table 2 Program 02: 0.0000 Execution Interval (seconds) *Table 3 Subroutines End Program 11.
TDR100 52
Campbell Scientific Companies Campbell Scientific, Inc. (CSI) 815 West 1800 North Logan, Utah 84321 UNITED STATES www.campbellsci.com • info@campbellsci.com Campbell Scientific Africa Pty. Ltd. (CSAf) PO Box 2450 Somerset West 7129 SOUTH AFRICA www.csafrica.co.za • cleroux@csafrica.co.za Campbell Scientific Australia Pty. Ltd. (CSA) PO Box 444 Thuringowa Central QLD 4812 AUSTRALIA www.campbellsci.com.au • info@campbellsci.com.au Campbell Scientific do Brazil Ltda.