TriSCAN® Agronomic User Manual Version 1.
TriSCAN Manual Version 1.2a All rights reserved. No part of this document may be reproduced, transcribed, translated into any language or transmitted in any form electronic or mechanical for any purpose whatsoever without the prior written consent of Sentek Pty Ltd. All intellectual and property rights remain with Sentek Pty Ltd. All information presented is subject to change without notice.
TriSCAN Manual Version 1.2a Disclaimer The access tubes, probes and sensors supplied by Sentek are specifically designed to be used together. Other brands of probe and access tube are not compatible with the Sentek products and should not be used as they may damage Sentek equipment. Damage to Sentek equipment through incorrect use will invalidate warranty agreements. The TriSCAN sensor produces an output in volumetric ion content (VIC).
TriSCAN Manual Version 1.2a Table of Contents Disclaimer .................................................................................................................3 Table of Contents......................................................................................................4 List of Figures............................................................................................................i List of Tables...............................................................................
TriSCAN Manual Version 1.2a Appendix 1. Units of Salinity Measurement and Conversion Factors................ 41 Appendix 2: Guidelines for Interpretation of Water Salinity for Irrigation ........42 Appendix 3: Soil Salinity Classes and Crop Growth.............................................43 Appendix 4: Crop Tolerance and Yield Potential of Selected Crops as Influenced by Irrigation Water Salinity and Soil Salinity ....................................
TriSCAN Manual Version 1.2a List of Figures Figure 1. Cut-away view of the TriSCAN probe..............................................................................................................................5 Figure 2. Sensor output .........................................................................................................................................................................7 Figure 3. Example of sensor address 5...............................................................
TriSCAN Manual Version 1.2a List of Tables Table 1. Salinity Measurement Units and their Abbreviations......................................................................................................2 Table 2. Expected air and water counts for different sensors.......................................................................................................14 Table 3. Default Calibration Coefficients .................................................................................................
TriSCAN Manual Version 1.2a Introduction TriSCAN: Sentek’s Fertilizer/Salinity and Soil Water Monitoring System Monitoring, understanding and managing irrigated water and nutrients, so that they stay within the active crop’s root zone, is one of the key challenges in modern agriculture. This is necessary in order to develop long term, environmentally sustainable irrigation and land management practices.
TriSCAN Manual Version 1.2a When ionically bonded compounds like NaCl are added to water, they dissociate (break up) into their + constituent positively and negatively charged ions (Na and Cl ). This phenomenon causes water, which in its pure state is a poor conductor of electricity, to become a good electrical conductor. The EC of a solution is dependent on the type of ions present, their concentration and the temperature of the solution.
TriSCAN Manual Version 1.2a extent and frequency of bare spots is often an indication of the concentration of salts in the soil. If the salinity level is not sufficiently high to cause barren spots, the crop appearance may be irregular in vegetative vigour. Where does the salt come from? The presence of excess salts on the soil surface and in the root zone characterizes all saline soils. The main source of all salts in the soil is the primary rock minerals from which they derive.
TriSCAN Manual Version 1.2a . The crop does not respond to the extremes of low or high salinity in the rooting depth uniformly, but integrates water availability, and takes water from wherever it is most readily available. Irrigation timing is thus important in maintaining soil water availability. This reduces problems caused when the crop must draw a significant portion of its water from the less available, highly saline soil water deeper in the root zone.
TriSCAN Manual Version 1.2a What is TriSCAN? TriSCAN Features TriSCAN is the world’s first near-continuous in-field monitoring probe to measure soil water content and soil salinity throughout a soil profile. Soil water and salinity measurements are taken by the same sensor successively. The TriSCAN technology is protected by various world patents. Sensor and Probe The sensor consists of a tubular housing with two conductive surfaces.
TriSCAN Manual Version 1.2a TriSCAN Applications A Fertilizer Management Tool and Soil Salinity Early Warning System Sentek has developed TriSCAN to provide a tool for monitoring, understanding and managing irrigation water and nutrients, so that they are maintained within the active crop root zone, where they are taken up to the benefit of the plant and irrigator. These are key challenges of irrigation management today to generate long term, sustainable irrigation practices.
TriSCAN Manual Version 1.2a How does the TriSCAN sensor work? Sensor output and measurement units The TriSCAN sensor provides two outputs. The first output is a signal of dimensionless frequency (raw count), that is converted via a normalization equation and then a default or user-defined calibration equation into volumetric soil water content. The measurement unit is thus volumetric water content (Vol %) or millimetres of water per 100 mm of soil depth.
TriSCAN Manual Version 1.2a Salinity: There are two levels at which resolution and accuracy may be considered with regard to the TriSCAN® sensor: • Resolution and accuracy of the electronic sensor • Resolution and accuracy of the benchmarking (correlation of VIC to EC) procedure The resolution of the electronic sensor, i.e. the smallest measurable increment, has been determined to be as low as 1 microSiemen/cm (0.001 mS/cm) in dry soil conditions, and as high as 14 micoSiemen/cm (0.
TriSCAN Manual Version 1.2a Getting TriSCAN ready for logging Probe Assembly and Sensor Addressing Assembling the Probe The TriSCAN probe consists of the following components: • Handle set with screws • Interface board • TriSCAN sensors • Probe Rod Assemble the probe following these steps: 1. Insert the probe handle into the top of the probe rod, with the lugs on the handle facing the connector side of the probe rod. 2. Attach the interface board to the probe rod.
TriSCAN Manual Version 1.2a 4. Insert the large screws into the holes in the side of the handle and tighten to hold them in place. Be careful not to over tighten the screws, as this may damage the interface board. 5. Locate the desired sensor positions on the probe rod, keeping in mind that each probe connection is spaced 100 mm apart. 6.
TriSCAN Manual Version 1.2a 9. Firmly plug the sensor into the connector on the probe rod, ensuring that all the pins are correctly aligned. 10. Repeat for the other sensors. Addressing the Sensors After positioning and securing each sensor in its proper location, every sensor on a probe needs to be assigned a unique address. The sensor address is set by changing the position of the address link on the ribbon cable board of the sensor.
TriSCAN Manual Version 1.2a For each probe, assign the top sensor with the lowest address (e.g. address 1) and then address each sensor below it with a sequentially higher address, such as 2, 3, 4 and so on. Probe Configuration and Normalization The probe is now ready to normalize. The following paragraphs outline the procedure for normalizing the probe using the IP Configuration Utility Software Version 1.4.1 or later.
TriSCAN Manual Version 1.2a Step 3 – Getting the configuration from the probe To detect the probe configuration, click on the Auto-detect Sensors button. This will automatically detect all the sensors on the probe. After the sensors are detected the configuration information will be displayed in the list. Step 4 – Changing the sensor depths 1. 2. 3. Click on the sensor depth when it is selected and it will go into edit mode as shown above.
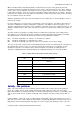
TriSCAN Manual Version 1.2a 3. Repeat this process for each sensor on the probe. The expected air and water counts are dependent on the sensor type and sampling mode. Normalization values outside the expected range may indicate errors in the normalization steps or problems with the hardware. Table 2.
TriSCAN Manual Version 1.2a To change the probe address, type the new address in the Address tab on the Probe Configuration page. The address of the probe should be in the range 1-65534 for most types of probes. Probes supporting specific protocols such as SDI-12 and Modbus accept only addresses in their specific formats (i.e. ASCII '0''9', 'a'-'z', 'A'-'Z' for SDI-12 probes, 1 to 247 for Modbus probes).
TriSCAN Manual Version 1.2a Some important information on the configuration of the TriSCAN sensors is summarized in Table 4. Table 4. Configuration Information for TriSCAN sensors Sensor Address Displays the sensor address for each sensor. Note 1: Moisture sensor addresses start at 1. The sensor address is controlled by the address jumper plug on the physical probe sensor assembly (refer to section of Probe Assembly and Sensor Addressing). Non-existent sensors will not be assigned a sensor address e.g.
TriSCAN Manual Version 1.2a In Total Sentek Smart Probes support a feature, by which the probe can provide a sum of values of the selected sensors. This is useful when an overall amount of water in the soil profile is to be found. A tick specifies that the sensor is used in the “In Total Moisture Calculations”. Double click in this column to change which sensors are used. A red cross or a blank cell specifies that the sensor is not used in the “In Total Moisture Calculations”.
TriSCAN Manual Version 1.2a Site Selection The key to effective soil water and soil volumetric ion content (VIC) monitoring is to select sites which truly represent irrigation management areas. The same basic site selection principles apply to the full range of Sentek soil moisture and salinity monitoring devices. In addition, when monitoring soil solution VIC, consideration of VIC variability in relation to the irrigation emitter needs to be taken into account.
TriSCAN Manual Version 1.2a If different soil types are ignored in terms of their different irrigation scheduling requirements and nutrient management, crop setbacks or failures may occur. This effect is displayed in the aerial photograph of a citrus orchard (Photo 1). Photo 1.
TriSCAN Manual Version 1.2a Climate The most commonly recognized factor in influencing the amount of crop transpiration is the weather. Temperature Crops need to draw up water to compensate for water use through transpiration (water loss through the leaves) and evaporation (water loss from the surface of soil and leaves). The demand increases with increasing temperature up to a maximum threshold for each crop (when the stomata close and photosynthesis stops).
TriSCAN Manual Version 1.2a texture in governing how much water and air move in soil and therefore their availability to crops. Roots penetrate more easily and rapidly in soils that have stable aggregates, than in similar soil types that have no or highly developed structures. The effectiveness of soil moisture, air and nutrient utilization, is related to the efficiency of root colonization of the entire soil profile. Soil depth The effective depth of soil affects the extent of root penetration.
TriSCAN Manual Version 1.2a Topography Topography relates to the configuration of the land surface and is described in terms of differences in aspect, elevation and slope.
TriSCAN Manual Version 1.2a Fertilizer management In order to ensure that no nutrients are deficient, fertilizer applications are normally based on soil and/or leaf sample analyses. The degree of precision varies from a rough averaging approach, to precision farming where sample points are matched to requirements using satellite tracking technology. Healthy crops require more water and have different nutrient dynamics to crops that have been stunted or diseased through inefficient fertilizer management.
TriSCAN Manual Version 1.2a Then the soils, Then the type of irrigation and system layout, And finally, the crop types. Overlaying all this information makes it possible to identify, within a property, areas (zones) that have significantly different requirements. In the example used, the property has been divided into four macro zones. Each macro zone requires a monitoring site.
TriSCAN Manual Version 1.2a Micro scale zone selection During macro zone selection you identified the irrigation management units on your property. Micro scale zone selection targets the actual site of the access tube in relation to crop and irrigation delivery point. Note: Micro zone selection is equally as important as macro zone selection and has a direct effect on the representative value of the data. In soil-based monitoring, the measurements are taken from a small part of the root zone.
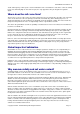
TriSCAN Manual Version 1.2a soil fertility is indicated at 30 cm depth than at all others. This is indicative of previous cropping history and fertilizer applications. Figure 6. Example of EC distribution uniformity in a potato field Crop: Potato Irrigation: Centre Pivot Water DU = 79.1% Salinity DU = 86.9% (10cm), 85.4% (30cm), 91.2% (50cm).
TriSCAN Manual Version 1.2a Fertilizer types and application methods It is essential that notice is taken of the fertilizer application method. The following factors should be taken into account: • The position of the edge of the wetting pattern, where salts will accumulate • Points of concentration of fertilizer application, which vary according to application method eg. spot, within-row, ring or band • Mineralization rates of fertilizers eg. animal manures, compost and urea.
TriSCAN Manual Version 1.2a Access Tube and Probe Installation The information provided below is a summary only. Further information is provided in the Access Tube Installation Guide Version 1.0. It is recommended that the probes be installed by a trained Sentek installation specialist. The aim of the installation is to cause minimum disturbance to the crop and soil profile. Disturbances to the soil may produce pockets of air or loosely packed soil material.
TriSCAN Manual Version 1.2a 11. Use a sledgehammer to tap the dolly until the access tube is embedded approximately 5 cm into the soil. 12. Place the auger inside the access tube and turn the handle clockwise. Auger ahead of the access tube by approximately 20 cm (until the pen mark made in step 6 is flush with the top of the access tube). 13. Take the auger out of the tube and empty the soil using the small auger cleaning tool No. 1. 14. Select dolly No. 1 or dolly No.
TriSCAN Manual Version 1.2a Installing the Top Cap The top cap assembly is installed after the access tube has been cleaned and the bottom stopper fitted. To install the top cap assembly follow these steps: 1. Ensure the 4 cm of access tube protruding from the soil is clean on the inside and the outside. 2. With a silicone gun and new nozzle, apply three rings of silicone around the outside of the access tube about 1 cm below the top rim of the tube. 3. Unscrew the cap from the top cap assembly base.
TriSCAN Manual Version 1.2a EasyAG TriSCAN Installation The EasyAG TriSCAN is installed using the same technique as the standard EasyAG probes. The information provided below is a summary only. Further information is provided in the EasyAG Installation Guide Version 3.0. Users should read this Guide prior to installing the EasyAG probes. Assembling the stabilization plate The stabilization plate can be used on both flat ground and raised soil beds.
TriSCAN Manual Version 1.2a 2. As the probe enters the prepared hole in the soil, it shaves off a soil residue that is eventually stored in the cutting tip or falls to the bottom of the hole. 3. Slide the dolly rubber to the top of the EasyAG dolly. Insert the EasyAG dolly into the access tube and position it on top of the joiner at the base of the access tube. Gently slide the dolly rubber into the top cap to stabilize the EasyAG dolly. 4.
TriSCAN Manual Version 1.2a Benchmarking Soil Salinity – TriSCAN Calibration The TriSCAN sensor currently provides an output in VIC (Volumetric Ion Content). This is sufficient for the monitoring of trends in changing soil salinity. In many instances, however, it is important to be able to relate VIC to soil Electrical Conductivity (EC). The following procedure outlines a simple methodology for benchmarking different levels of VIC in relation to EC.
TriSCAN Manual Version 1.2a Step 3 Place a drum or bucket with the bottom cut out around each probe, with the base buried slightly to minimize lateral movement of water. Add 25 litres of normal irrigation water (low EC) around one probe (Probe 1 P1). Apply this in stages so that there is no overflow and such that it is continuous, with no air infiltration. -1 Add 25 litres of irrigation water mixed to 5-10 dSm , with NH4NO3 fertilizer, to the other probe (Probe 2 P2).
TriSCAN Manual Version 1.2a Step 6 Analyse soil EC for each sample using one of the methods below. Laboratory Methods Saturated Paste Extract The standard procedure for measuring soil EC consists of mixing a soil sample with sufficient water to produce a saturated paste, and then extracting the solution by suction for measurement. Measuring the electrical conductivity (ECe) of a saturation extract has an advantage in that saturation percentage is directly related to field available moisture range.
TriSCAN Manual Version 1.2a For very sandy soils, the %CLAY can be assumed to be close to zero (0). Note: If the samples are tested in separate batches for ease of handling, then a couple of quality control (QC) samples, should be added to each batch. These samples are then used to make a correction for interassay variation.
TriSCAN Manual Version 1.2a Salinity and Soil Water Data Interpretation The effect of dissolved salts on plant growth depends on their concentration in the soil solution at any particular time or at a given soil water content. The following examples using IrriMAX 6 software demonstrate some of the expected output from the TriSCAN sensors.
TriSCAN Manual Version 1.2a The salinity increase during the irrigation event as the TriSCAN™ salinity model is currently unable to detect the correct soil salinity during soil water contents at or near to saturation. This rise of salinity during the irrigation event is only apparent and should be ignored. Focus should be placed on the data before and after the irrigation event, when rapid drainage has slowed.
TriSCAN Manual Version 1.2a Example 2 Multiple irrigation events are plotted with soil water content and salinity concentrations (VIC) against time in Figure 11. The initial soil salinity level on October 31 before 12.00 pm was represented by a value of 832.2 -1 VIC (0.1 dSm ). A horizontal ruler is located slightly below this threshold at 775.18 VIC to provide a reference baseline for salinity. -1 The first irrigation applied shortly after 12.00 pm on October 31 contained salts measuring 5.
TriSCAN Manual Version 1.2a Example 3 ® Figure 12 illustrates the movement of salts at the bottom of the wetting front in drip irrigation in IrriMAX 6. Soil moisture data showed that the bottom of the wetting front just reached to a depth of 50 cm with each irrigation With successive irrigations, estimated EC increased from 1162µS/cm on 20 November, to 1233µS/cm on 22 November and 1287µS/cm on 23 November at this depth.
TriSCAN Manual Version 1.2a Appendix 1. Units of Salinity Measurement and Conversion Factors Table 6. Useful Conversion Factors Electrical Conductivity 1 Scm -1 (1 mhocm -1) = 1000 mScm -1 (1000 mmhoscm -1) 1 dSm -1 = 1000 µScm -1 (1000 micromhoscm -1) Conductivity to mmol (+) per liter: mmol (+)/L = 10 X EC (EC in dSm -1) for irrigation water and soil extracts in the range of 0.1 – 5 dSm -1 Conductivity to osmotic pressure in bars: OP = 0.
TriSCAN Manual Version 1.2a Appendix 2: Guidelines for Interpretation of Water Salinity for Irrigation Table 7. Gui delines for Interpretations of Water Salinity for Irrigation (from Ayars & Westcott) 1 Salinity measure Units Degree of Restriction on Use None Slight to Moderate Severe EC w dSm-1 < 0.7 0.7 – 3.0 > 3.
TriSCAN Manual Version 1.2a Appendix 3: Soil Salinity Classes and Crop Growth Table 8.
TriSCAN Manual Version 1.2a Appendix 4: Crop Tolerance and Yield Potential of Selected Crops as Influenced by Irrigation Water Salinity and Soil Salinity Table 9.
TriSCAN Manual Version 1.2a Table 10.
TriSCAN Manual Version 1.2a Table 11.
TriSCAN Manual Version 1.2a Table 12. Crop Tolerance and Yield Potential of Fruit Crops as Influenced by Irrigation Water Salinity (EC w ) and Soil Salinity (EC e) – from Ayars and Westcott 1994 Fruit crops Date palm (Phoenix dactylifera) Grapefruit (Citrus paradisi) Orange (Citrus sinensis) Peach (Prunus persica) Apricot (Prunus armeniaca) Grape (Vitis sp.) Almond (Prunus dulcis) Plum, prune (Prunus domestica) Blackberry (Rubus sp.) Boysenberry (Rubus ursinus) Strawberry (Fragaria sp.
TriSCAN Manual Version 1.2a Appendix 5: Relative Salt Tolerance of Agricultural Crops Table 13. Relative Salt Tolerance of Agricultural Crops Tolerant Yield loss begins at 6.0 – 10.
TriSCAN Manual Version 1.2a Moderately Tolerant Yield loss begins at 3.0 – 6.
TriSCAN Manual Version 1.2a Moderately Sensitive Yield loss begins at 1.3 – 3.
TriSCAN Manual Version 1.2a Sensitive Yield loss begins at <1.
TriSCAN Manual Version 1.2a Appendix 6: Relative Effect of Fertilizer Materials on the Soil Solution Table 14. Relative Effect of Fertilizer Materials on the Soil Solution (from Ayars and Westcot) Material Anhydrous ammonia Ammonium nitrate Ammonium nitrate-lime Ammonium phosphate (11-48) Ammonium sulphate Calcium carbonate (limestone) Calcium cyanamide Calcium nitrate Calcium sulfate Diammonium phosphate Dolomite (calcium and magnesium carbonates) Kainit, 13.5 % Kainit, 17.
TriSCAN Manual Version 1.2a References Ayars, R.S. and Wescot, D.W. (1985) ‘Water quality for agriculture.’ FAO Irrigation and Drainage Paper 29 Rev. 1. Food and Agriculture Organization of the United Nations. Rome. Maas, E.V. (1986). ‘Salt tolerance of plants.’ Applied Agricultural Research. 1:12-26. Maas, E.V. and Hoffmand, G.J. (1977). Crop salt tolerance- current assessment. J. Irrig. and Drainage Div., ASCE 103(IR2): 115-134. Rhoades, J.D., Kandiah, A. And Mashali, A.M. (1992).
TriSCAN Manual Version 1.2a Acknowledgements The management of Sentek Pty. Ltd. wish to thank the following for their valuable contributions to the TriSCAN™ product. Dr. John Hutson and Ms. Leslie McKluskey, Flinders University of South Australia. Mr. Steve Marks and family, Caurnamont Farms. Ms. Shannon Pudney, South Australian Research and Development Institute (SARDI). Ms. Nicole Wilson, past employee.