
Measurement and Control Module Operators Manual

SECTION 13. CR10 MEASUREMENTS
13-10
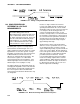
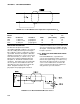
source resistance at point P (column 5) is
essentially the same as the input source
resistance of configuration A. Moving R
f'
out
to the thermistor as shown in Figure 13.3-7C
optimizes the signal settling time because it
becomes a function of R
f
and C
w
only.
Columns 4 and 7 list the signal voltages as a
function of temperature using a 2000 mV
excitation for configurations A and C,
respectively. Although configuration A has a
higher output signal (2500 mV input range), it
does not yield any higher resolution than
configuration C which uses the ±250 mV
input range.
NOTE: Since R
f
' attenuates the signal in
configuration B and C, one might consider
eliminating it altogether. However, its
inclusion "flattens" the non-linearity of the
thermistor, allowing more accurate curve
fitting over a broader temperature range.
3. Where possible, run excitation leads and
signal leads in separate shields to minimize
transients.
4. Avoid PVC-insulated conductors to
minimize the effect of dielectric absorption
on input settling time.
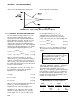
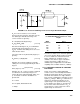
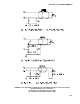
5. Use the CR10 to measure the input settling
error associated with a given configuration.
For example, assume long leads are
required but the lead capacitance, Cw, is
unknown. Configure Rf on a length of
cable similar to the measurement. Leave
the sensor end open as shown in Figure
13.3-8 and measure the result using the
same instruction parameters to be used
with the sensor. The measured deviation
from 0V is the input settling error.
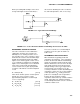
6. Most Campbell Scientific sensors are
configured with a small bridge resistor, R
f
,
(typically 1 kohm) to minimize the source
resistance. If the lead length of a Campbell
Scientific sensor is extended by connecting
to the pigtails directly, the effect of the lead
resistance, R
l
, on the signal must be
considered. Figure 13.3-9 shows a
Campbell Scientific Model 107 sensor with
500 feet of extension lead connected
directly to the pigtails. Normally the signal
voltage is proportional to R
f
/(R
s
+R
b
+R
f
),
but when the pigtails are extended, the
signal is proportional to
(R
f
+R
l
)/(R
s
+R
b
+R
f
+R
l
). R
l
is much smaller
than the other terms in the denominator
and can be discarded. The effect on the
signal can be analyzed by taking the ratio
of the signal with extended leads, V
sl
to the
normal signal, V
s
:
V
sl
/V
s
= (R
f
+R
l
)/R
f
Plugging in values of R
f
=1k and R
l
=.012k
(500' at 23 ohms/1000', Table 13.3-2) gives
an approximate 1% error in the signal with
extended leads. Converting the error to °C
gives approximately a 0.33=°C error at 0°C,
0.53°C error at 20°C, and a 0.66°C error at
40°C. The error can be avoided by
maintaining the pigtails on the CR10 end of
the extended leads because R
l
does not
add to the bridge completion resistor, R
f
,
and its influence on the thermistor
resistance is negligible.
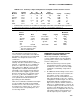
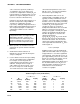
TABLE 13.3-7. Source Resistances and Signal Levels for YSI #44032 Thermistor Configurations
Shown in Figure 13.3-7 (2V Excitation)
--------A-------- -----B----- -------C-------
TR
s
R
o
V
s
(mV) R
o
@P R
o
V
s
(mV)
(kohms) (kohms) (kohms) (kohms)
-40 884.6 29.0 66 30.0 1 2.2
-20 271.2 27 200 27.8 1 6.6
0 94.98 22.8 480 23.4 1 15.9
+25 30.00 15.0 1000 15.2 1 32.8
+40 16.15 10.5 1300 10.6 1 42.4
+60 7.60 6.1 1596 6.1 1 51.8