
User's Guide
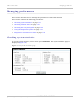
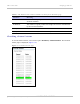
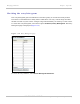
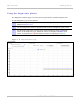
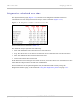

Table Of Contents
- PTP 250 User Guide
- Safety and regulatory information
- Contents
- List of Figures
- List of Tables
- About This User Guide
- Chapter 1: Product description
- Chapter 2: Planning considerations
- Chapter 3: Legal information
- Chapter 4: Reference information
- Chapter 5: Installation
- Chapter 6: Configuration and alignment
- Chapter 7: Operation
- Chapter 8: Troubleshooting
- Testing link end hardware
- Testing when PoE LEDs do not illuminate correctly
- Testing after a lightning strike
- Test flowcharts
- AC LED is off
- AC LED is flashing
- PORT LED is off
- PORT LED is flashing
- Test Ethernet packet errors reported by ODU
- Test Ethernet packet errors reported by managed switch or router
- Test ping packet loss
- Test resistance in the ODU cable
- Testing the radio link
- Testing link end hardware
- Glossary

PTP 250 User Guide Managing performance
phn-2182_003v004 (Oct 2011)
UNDER DEVELOPMENT
7-23
Diagnostics calculated over time
The System Status page (Figure 7-5) contains seven diagnostic attributes that are
calculated over time and presented as arrays of four elements (Figure 7-12).
Figu
re 7-12 Diagnostic attributes calculated over time
These attributes are defined in Table 7-5.
The elem
ent arrays represent the following:
• Max: The maximum value measured over the last hour.
• Avg: The mean of a set of values recorded at one second intervals over the last hour.
• Min: The minimum value measured the last hour.
• Latest: The latest value measured.
If the link has been running for less than one hour, then the values are calculated over the
time that has elapsed since the link was established.
These attributes can be plotted against time, downloaded and reset by using the
Diagnostics Plotter page, as described in Using the diagnostics plotter on
page 7-21.