
User's Guide
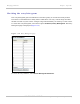
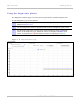
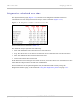

Table Of Contents
- PTP 250 User Guide
- Safety and regulatory information
- Contents
- List of Figures
- List of Tables
- About This User Guide
- Chapter 1: Product description
- Chapter 2: Planning considerations
- Chapter 3: Legal information
- Chapter 4: Reference information
- Chapter 5: Installation
- Chapter 6: Configuration and alignment
- Chapter 7: Operation
- Chapter 8: Troubleshooting
- Testing link end hardware
- Testing when PoE LEDs do not illuminate correctly
- Testing after a lightning strike
- Test flowcharts
- AC LED is off
- AC LED is flashing
- PORT LED is off
- PORT LED is flashing
- Test Ethernet packet errors reported by ODU
- Test Ethernet packet errors reported by managed switch or router
- Test ping packet loss
- Test resistance in the ODU cable
- Testing the radio link
- Testing link end hardware
- Glossary

Managing performance Chapter 7: Operation
7-22
UNDER DEVELOPMENT
phn-2182_003v004 (Oct 2011)
Table 7-11 Diagnostics Plotter attributes
Attribute Meaning
Link Loss Defined in Table 7-5.
Transmit Power Defined in Table 7-5.
Receive Power Defined in Table 7-5.
Receive Vector Error Defined in Table 7-5.
Transmit Data Rate Defined in Table 7-5.
Receive Data Rate Defined in Table 7-5.
Aggregated Data Rate The sum of the transmit and receive data rates (Mbps).
V/H Ratio Defined in Table 7-5.
The maximum, mean, minimum and latest values of some of these statistics are also
displayed on the System Status page. See Diagnostics calculated over time on
page 7-23.
Downloading diagnostic data
To download a statistic to a CSV file, use the Download Controller. Select the statistic from
the list and select Download File.
The CSV file contains at most 5784 entries, recorded over a 32 day period:
• 3600 entries recorded in the last hour.
• 1440 entries recorded in the previous 24 hours.
• 744 entries recorded in the previous 31 days.
Resetting statistics
To reset all the statistics that are available in the Diagnostics Plotter page, select Reset
Histogram Statistics.