
User's Manual
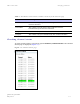

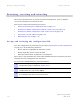

Table Of Contents
- PTP 250 User Guide
- Copyrights
- Safety and regulatory information
- Contents
- List of Figures
- List of Tables
- About This User Guide
- Chapter 1 Product description
- Chapter 2 Planning considerations
- Chapter 3 Legal information
- Chapter 4 Reference information
- Chapter 5 Installation
- Chapter 6 Configuration and alignment
- Chapter 7 Operation
- Chapter 8 Troubleshooting
- Testing link end hardware
- Testing when PoE LEDs do not illuminate correctly
- Testing after a lightning strike
- Test flowcharts
- AC LED is off
- AC LED is flashing
- PORT LED is off
- PORT LED is flashing
- Test Ethernet packet errors reported by ODU
- Test Ethernet packet errors reported by managed switch or router
- Test ping packet loss
- Test resistance at the PoE end of the drop cable
- Testing the radio link
- Testing link end hardware
- Glossary

PTP 250 User Guide Managing performance
phn-2182_002v000
May 2011
7-21
Using the diagnostics plotter
The Diagnostics Plotter page is used to plot key performance statistics against time.
To plot diagnostics, proceed as follows:
1
Select menu option Diagnostics Plotter. The Diagnostics Plotter page is
displayed (Figure 7-11).
2
Use the Diagnostics Selector drop-down list to select a diagnostic type to
plot.
3
Use the Trace Selection to select traces of the maximum, mean or minimum
values of the diagnostic type. Maximum values are displayed in blue, mean
values are displayed in red and minimum values are displayed in green.
Figure 7-11 Diagnostic Plotter page