
User Manual
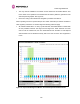
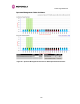


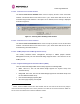
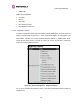
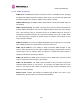

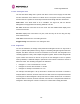
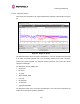
Table Of Contents
- 1 About This User Guide
- 2 Avoiding Hazards
- Getting Started
- 3.1 For Your Safety
- 3.2 Welcome
- 3.3 Product Description
- 3.4 Warranty
- 4 Product Architecture
- 5 General Considerations
- 5.1 Spectrum Planning
- 5.2 Licenses and Region Codes
- 5.3 Operational Restrictions
- 5.4 Channel Bandwidth Operation
- 5.5 PTP 54500 Specific Frequency Planning Considerations
- 5.6 PTP 58500 Specific Frequency Planning Considerations
- 5.7 Distance
- 5.8 Networking Information
- 5.9 Lightning Protection and Regulations
- 5.10 Electrical Requirements
- 6 Site Planning
- 6.1 Site Selection Criteria
- 6.1.1 ODU Site Selection
- 6.1.2 PTP 500 Series Bridge PIDU Plus Site Selection
- 6.1.3 Path Loss Considerations
- 6.1.4 Definitions
- 6.1.5 PTP 54500 Product Variant - Link Loss, Output Power and System Threshold versus Modulation Mode
- 6.1.6 PTP 58500 Product Variant - Link Loss, Output Power and System Threshold versus Modulation Mode
- 6.1 Site Selection Criteria
- 7 Installation
- 7.1 Preparation
- 7.2 Installation Procedure
- 7.3 Tools Required
- 7.4 Installation Support
- 7.5 Legal Disclaimer
- 7.6 Mounting the ODUs
- 7.7 Connecting Up
- 7.7.1 Preparing the PIDU Plus To ODU Cable
- 7.7.2 Making the Connections at the ODU
- 7.7.3 Making the PTP 300/500/600 Series Bridge PIDU Plus Connection At The ODU
- 7.7.4 Routing the Cable
- 7.7.5 Fitting a Lightning Protection Unit
- 7.7.6 Grounding the Installation
- 7.7.7 Making the ODU Connection at the PTP 300/500/600 Series Bridge PIDU Plus
- 7.7.8 Making the Network Connection at The PIDU Plus – PTP 500 Series Bridge
- 7.7.9 Mounting the PTP 300/500/600 Series Bridge PIDU Plus
- 7.7.10 Powering Up
- 7.7.11 Aligning the PTP 500 Series Bridge ODUs
- 7.7.12 Additional Installation Notes
- 8 Web Page Reference
- 8.1 Home Page – PTP 500 Series Bridge
- 8.2 Systems Status Page
- 8.3 System Administration Pages
- 8.3.1 System Configuration
- 8.3.2 Statistics Page
- 8.3.3 Detailed Counters Page
- 8.3.4 Install Pages
- 8.3.5 Graphical Install
- 8.3.6 Software Upgrade
- 8.3.7 Spectrum Management
- 8.3.7.1 Wireless Channels
- 8.3.7.2 Spectrum Management Measurements
- 8.3.7.3 Measurement Analysis
- 8.3.7.4 The Spectrum Management Master / Slave Relationship
- 8.3.7.5 Spectrum Management Configuration
- 8.3.7.6 Barring Channels
- 8.3.7.7 Master and Slave Channel Spectrum Graphics
- 8.3.7.8 Active Channel History
- 8.3.7.9 Viewing Historic Spectrum Management Metrics
- 8.3.8 Spectrum Management (Fixed Frequency)
- 8.3.9 Spectrum Management Control - With Operational Restrictions
- 8.3.10 Remote Management Page
- 8.3.10.1 Control Access to HTTP Interface
- 8.3.10.2 Control Access to Telnet Interface
- 8.3.10.3 SNMP (Simple Network Management Protocol)
- 8.3.10.4 Supported Management Information Bases (MIBS)
- 8.3.10.5 Diagnostics Alarms
- 8.3.10.6 SNMP Configuration
- 8.3.10.7 SMTP (Simple Mail Transport Protocol)
- 8.3.10.8 SNTP (Simple Network Time Protocol)
- 8.3.10.9 Setting the clock
- 8.3.11 Diagnostics
- 8.3.12 Change System Administration Password
- 8.3.13 License Key
- 8.3.14 Properties
- 8.3.15 Reboot
- 9 Recovery Mode
- 10 Fault Finding
- 11 Lightning Protection
- 12 Wind Loading
- 13 PTP 500 Series Bridge – Connectorized Model
- 13.1 Scope
- 13.2 Product Description
- 13.3 Software/Features
- 13.4 Deployment Considerations
- 13.5 Link Budget
- 13.6 Regulatory Issues
- 13.7 Installation
- 13.7.1 Antenna Choice
- 13.7.2 Cables and Connectors
- 13.7.3 Tools
- 13.7.4 Miscellaneous supplies
- 13.7.5 Mounting the Connectorized 500 Series Bridge
- 13.7.6 Mounting the antennas
- 13.7.7 Alignment Process
- 13.7.8 Aligning Dual Polar Antennas
- 13.7.9 Aligning Separate Antennas
- 13.7.10 Completing the Installation
- 13.7.11 Antenna Cable Fixing
- 13.7.12 Antenna Connection Weatherproofing
- 13.8 Additional Lightning Protection
- 14 Data Rate Calculations
- 15 AES Encryption Upgrade
- 16 Legal and Regulatory Notices
- 16.1 Important Note on Modifications
- 16.2 National and Regional Regulatory Notices – PTP 58500 variant
- 16.3 National and Regional Regulatory Notices – PTP 54500 Variant
- 16.4 Exposure
- 16.5 Legal Notices
- 16.5.1 Motorola Inc. End User License Agreement
- 16.5.1.1 Definitions
- 16.5.1.2 Grant of License
- 16.5.1.3 Conditions of Use
- 16.5.1.4 Title; Restrictions
- 16.5.1.5 Confidentiality
- 16.5.1.6 Right to Use Motorola’s Name
- 16.5.1.7 Transfer
- 16.5.1.8 Updates
- 16.5.1.9 Maintenance
- 16.5.1.10 Disclaimer
- 16.5.1.11 Limitation of Liability
- 16.5.1.12 U.S. Government
- 16.5.1.13 Term of License
- 16.5.1.14 Governing Law
- 16.5.1.15 Assignment
- 16.5.1.16 Survival of Provisions
- 16.5.1.17 Entire Agreement
- 16.5.1.18 Third Party Software
- 16.5.2 Hardware Warranty in U.S.
- 16.5.3 Limit of Liability
- 16.5.1 Motorola Inc. End User License Agreement
- 17 Specifications
- 18 FAQs
- 19 Glossary
- 20 Index

8 Web Page Reference
137
8.3.10.9 Setting the clock
The PTP 500 Series bridge has a system clock which can be used to supply accurate date
and time information in the absence of a SNTP server. The system clock is battery backed
and will continue to operate for several days if the 500 Series bridge has been switched off.
SNTP State: If the SNTP State is set to “Disabled”, see Figure 66, then the Remote
Management web page allows the following attributes to be set:
Set Time: Shows the current time in 24 hour mode. The three editable fields display hours
minutes and seconds.
Set Date: Displays the current date. The year, month and day can be set using the drop-
down selection boxes.
Time Zone: See Section.8.3.10.9 “Setting the clock”.
Daylight Saving: See Section 8.3.10.9 “Setting the clock”
8.3.11 Diagnostics
For the PTP 500 Series, the storage of link performance histograms is set to 31 days worth of
data. To optimize RAM (volatile memory) usage of a cascading histogram approach has been
adopted. The data is stored for one hour at a resolution of one second. The histograms use a
cascading approach to daisy chain multiple histograms together. When the first histogram fills
up the overflow from the first is used as an input to the next histogram in line. To optimize
memory utilization, a statistical analysis is performed on the overflow to reduce the amount of
data to be stored. The cascading histograms are defined as::
• Histogram 1: 1 hour at a resolution of 1 second
• Histogram 2: 24 hours at a resolution of 1 minute
• Histogram 3: 30 Days at a resolution of 1 hour
For example, when histogram 1 fills up and starts to overflow the first minute of overflow is
analyzed and the maximum, minimum and mean over that minute are computed and inserted
into histogram 2. When histogram 2 fills up and starts to overflow the first hour of overflow is
analyzed and the maximum, minimum and mean over that hour is computed and inserted into
histogram 3. When histogram 3 starts to overflow, the overflow data is simply discarded.