
User Manual


Web Page Reference
118
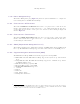
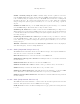
• Tx Data Rate
• Aggregate Data Rate
The diagnostic plotter uses a novel time representation in the x-axis which compresses the timeline
of the plot without sacrificing resolution.
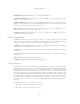
The trace selection allows the user to control which traces are plotted.
As with other management pages the page refresh period can be used to interactively monitor the
wireless link.
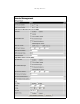
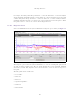
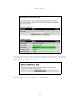
8.3.11.2 Diagnostics Download
The diagnostics Download page allows the system administrator to download snapshots of system
diagnostics.
Figure 72 CSV Download
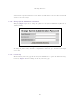
The following diagnostics are available:
• Vector Error
• Rx Power
• Tx Power
• Signal Strength Ratio V/H
• Link Loss
• Rx Data Rate
• Tx Data Rate
• Aggregate Data Rate
• Receive SNR
• Rx Gain
All diagnostics are extracted from the associated status and statistics web page histograms. They
are translated in a CSV file containing at most 578425 entries.