
User Manual


Web Page Reference
104
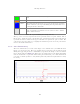
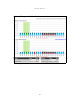
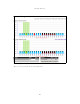
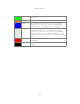
Green Active The channel is currently in use, hosting the Point-to-Point wireless
link.
Orange Interference The channel has interference above the intererence threshold
Blue Available The channel has an interference level below the interference threshold
and is considered by the Spectrum Management algorithm suitable for
hosting the Point-to-Point link.
Grey Barred The system administrator has barred this channel from use. For
improved visibility, an additional red ’lock’ symbol is used to indicate
that a channel is barred
Table 13 Spectrum Management change state key
The top of the colored bar represents the 99.9% percentile metric for specific channel. The ‘I’
Bar is used to display the mean of means and peak of means metrics. The lower horizontal bar
represents the mean of means and the upper horizontal bar represents the peak of means. The
vertical bar is used as a visual cue to highlight the statistical spread between the peak and the
mean of the statistical distribution.
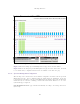
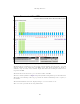
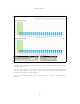
8.3.7.8 Active Channel History
The active channel history is a time series display of the channels used by the PTP 500 Series
Bridge over the last 25 hours. The active channel history is activated from the main Spectrum
Management page using the ‘Active Channel History’ hyperlink. An example of the active channel
history display is shown in Figure 62. Where there are parallel entries on the display this signifies
that the wireless link occupied this channel during the measurement period. The measurement
periods are one minute (from zero to sixty minutes) and twenty minutes from (60 minutes to twenty
five hours).
Figure 62 Active Channel History Screen