
User Manual


Web Page Reference
103
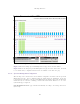
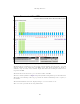
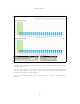
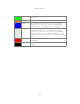
Figure 61 Example Spectrum Management Graphic
The X-axis shows a stylized view of the selectable wireless channels. It is important to note that
adjacent channels on the display have a 10 MHz overlap. The display separates the display of
channels to help the clarity of the resultant display. The axis is labeled using the channel center
frequencies in MHz.
The Y-axis shows the interference power levels from -100 to -40 dBm.
The active channel (channel 5 in Figure 61) is always marked using hatched green and white lines.
The width of the hatching is directly proportional the channel bandwidth spectral occupancy of
the channel.
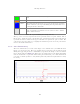
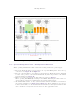
The individual channel metrics are displayed using a colored bar and an ‘I’ bar.
The colored bar represents the following channel state: