
Installation Guide


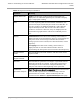
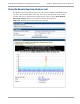
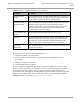
Table Of Contents
- PMP 450i and PTP 450i Configuration and User Guide
- Safety and regulatory information
- Contents
- List of Figures
- List of Tables
- About This Configuration and User Guide
- Chapter 1: Reference information
- Chapter 2: Configuration
- Preparing for configuration
- Task 1: Connecting to the unit
- Task 2: Configuring IP and Ethernet interfaces
- Configuring the AP IP interface
- NAT, DHCP Server, DHCP Client and DMZ in SM
- Configuring the SM IP interface with NAT disabled
- Configuring the SM IP interface with NAT enabled
- NAT tab of the SM with NAT disabled
- NAT tab of the SM with NAT enabled
- Reconnecting to the management PC
- VLAN Remarking and Priority bits configuration
- VLAN tab of the AP
- VLAN tab of the SM
- VLAN Membership tab of the SM
- PPPoE tab of the SM
- NAT Port Mapping tab of the SM
- Task 3: Upgrading the software version and using CNUT
- Task 4: Configuring General and Unit settings
- Task 5: Configuring security
- Isolating APs from the internet
- Encrypting radio transmissions
- Managing module access by passwords
- Requiring SM Authentication
- Filtering protocols and ports
- Encrypting downlink broadcasts
- Isolating SMs
- Filtering management through Ethernet
- Allowing management only from specified IP addresses
- Configuring management IP by DHCP
- Restricting radio Telnet access over the RF interface
- Security tab of the AP
- Filtering protocols and ports
- Protocol Filtering tab of the AP
- Port configuration tab of the AP
- Security tab of the SM
- Protocol Filtering tab of the SM
- Port Configuration tab of the SM
- Task 6: Configuring radio parameters
- Task 7: Setting up SNMP agent
- Task 8: Configuring syslog
- Task 9: Configuring remote access
- Task 10: Monitoring the AP-SM Link
- Task 11: Configuring quality of service
- Maximum Information Rate (MIR) Parameters
- Token Bucket Algorithm
- MIR Data Entry Checking
- Committed Information Rate (CIR)
- Bandwidth from the SM Perspective
- Interaction of Burst Allocation and Sustained Data Rate Settings
- High-priority Bandwidth
- Traffic Scheduling
- Setting the Configuration Source
- Quality of Service (QoS) tab of the AP
- DiffServ tab of the AP
- Quality of Service (QoS) tab of the SM
- DiffServ tab of the SM
- Task 12: Performing an Sector Wide SA
- Task 13: Zero Touch Configuration Using DHCP Option 66
- Task 14: Configuring Radio via config file
- Task 15: Configuring a RADIUS server
- Understanding RADIUS for PMP 450i
- Choosing Authentication Mode and Configuring for Authentication Servers - AP
- SM Authentication Mode – Require RADIUS or Follow AP
- Handling Certificates
- Configuring your RADIUS servers for SM authentication
- Assigning SM management IP addressing via RADIUS
- Configuring your RADIUS server for SM configuration
- Using RADIUS for centralized AP and SM user name and password management
- RADIUS Device Data Accounting
- RADIUS Device Re-authentication

Task 12: Performing an Sector Wide SA PMP 450i and PTP 450i Configuration and User
Guide
Table 56 Spectrum Analyzer attributes
Attribute Meaning
Display Data Path Both means that the vertical and horizontal paths are
displayed or an individual path may be selected to display
only a single-path reading.
Data For ease of parsing data and to facilitate automation, the
spectrum analyzer results may be saved as an XML file. To
save the results in an XML formatted file, right-click the
“SpectrumAnalysis.xml” link and save the file. If these
results are viewed in a browser, they are displayed in the
horizontal bar-graph fashion which was available prior to
12.1.
Display Instantaneous means that each reading (vertical bar) is
displayed with two horizontal lines above it representing the
max power level received (top horizontal line) and the
average power level received (lower horizontal line) at that
frequency.
Averaging means that each reading (vertical bar) is
displayed with an associated horizontal line above it
representing the max power level received at that frequency.
Registered SM
Count
This field displays the MAC address and Site Name of the
registered SM.
Maximum Count of
Registered SMs
This field displays the maximum number of registered SMs.
Duration This field allows operators to configure a specified time for
which the spectrum is scanned. If the entire spectrum is
scanned prior to the end of the configured duration, the
analyzer will restart at the beginning of the spectrum.
Continuous
Spectrum Analyzer
Start Continuous Spectrum Analysis
button ensures that
when the SM is powered on, it automatically scans the
spectrum for 10 seconds. These results may then be
accessed via the Tools => Spectrum Analyzer GUI page.
pmp-0957 (April 2015) 173