
User's Manual


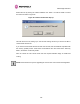
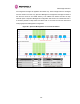

Table Of Contents
- PTP 600 User Guide
- Copyright Information
- Contents
- 1 About This User Guide
- 2 Avoiding Hazards
- Getting Started
- 4 Product Architecture
- 5 Radio Link Planning and Regulations
- 5.1 Spectrum Planning
- 5.2 Licenses and Region Codes
- 5.3 Operational Restrictions
- 5.4 Variable Channel Bandwidth Operation
- 5.5 PTP 25600 Specific Frequency Planning Considerations
- 5.6 PTP 45600 Specific Frequency Planning Considerations
- 5.7 PTP 48600 Specific Frequency Planning Considerations
- 5.8 PTP 49600 Specific Frequency Planning Considerations
- 5.9 PTP 54600 Specific Frequency Planning Considerations
- 5.10 PTP 58600 Specific Frequency Planning Considerations
- 5.11 PTP 59600 Specific Frequency Planning Considerations
- 5.12 Time Division Duplex (TDD) Synchronization
- 5.13 Link Mode Optimization
- 5.14 Distance
- 5.15 Networking Information
- 5.16 Lightning Protection
- 5.17 Electrical Requirements
- 5.18 Latency
- 6 Site Planning
- 6.1 Site Survey and Link Planning
- 6.2 Site Selection Criteria
- 6.2.1 ODU Site Selection
- 6.2.2 PTP 600 Series Bridge PIDU Plus Site Selection
- 6.2.3 Path Loss Considerations
- 6.2.4 Definitions
- 6.2.5 PTP 25600 System Threshold, Output Power and Link Loss
- 6.2.6 PTP 45600 System Threshold, Output Power and Link Loss
- 6.2.7 PTP 48600 System Threshold, Output Power and Link Loss
- 6.2.8 PTP 49600 System Threshold, Output Power and Link Loss
- 6.2.9 PTP 54600 System Threshold, Output Power and Link Loss
- 6.2.10 PTP 58600 System Threshold, Output Power and Link Loss
- 6.2.11 PTP 59600 System Threshold, Output Power and Link Loss
- 7 Installation
- 7.1 Preparation
- 7.2 Installation Procedure
- 7.3 Tools Required
- 7.4 Installation Support
- 7.5 Legal Disclaimer
- 7.6 Mounting the ODUs
- 7.7 Connecting Up
- 7.7.1 Preparing the PIDU Plus To ODU Cable
- 7.7.2 Making the Connections at the ODU
- 7.7.3 Making the PTP 600 Series Bridge PIDU Plus Connection At The ODU
- 7.7.4 Routing the Cable
- 7.7.5 Fitting a Lightning Protection Unit
- 7.7.6 Grounding the Installation
- 7.7.7 Making the ODU Connection at the PTP 600 Series Bridge PIDU Plus
- 7.7.8 Making the Network Connection at The PIDU Plus – PTP 600 Series Bridge
- 7.7.9 Mounting the PTP 600 Series Bridge PIDU Plus
- 7.7.10 Powering Up
- 7.8 Establishing a Radio Link
- 8 Web Page Reference
- 8.1 Home Page – PTP 600 Series Bridge
- 8.2 Systems Status Page
- 8.3 System Administration Pages
- 8.3.1 System Configuration
- 8.3.2 Statistics Page
- 8.3.3 Detailed Counters Page
- 8.3.4 Install Pages
- 8.3.5 Graphical Install
- 8.3.6 Software Upgrade
- 8.3.7 Spectrum Management
- 8.3.8 Spectrum Management (Fixed Frequency)
- 8.3.9 Spectrum Management Control - With Operational Restrictions
- 8.3.10 Spectrum Management – Example of PTP 25600 Product variant
- 8.3.11 Remote Management Page
- 8.3.12 Diagnostics
- 8.3.13 Change System Administration Password
- 8.3.14 License Key
- 8.3.15 Properties
- 8.3.16 Reboot
- 9 Recovery Mode
- 10 Lightning Protection
- 10.1 Overview
- 10.2 Detailed Installation
- 10.3 Installation Wiring
- 10.4 LPU Recommended Configurations
- 10.4.1 Typical Mast or Tower Installation
- 10.4.2 Typical Wall Installation
- 10.4.3 Mast or Tower Installation with E1/T1
- 10.4.4 Wall Installation with E1/T1
- 10.4.5 Mast or Tower Installation with GPS Sync Box
- 10.4.6 Wall Installation with GPS Sync Box
- 10.4.7 Mast or Tower Installation with GPS Sync Box and E1/T1
- 10.4.8 Wall Installation with GPS Sync Box and E1/T1
- 11 Troubleshooting (Fault Finding)
- 12 Wind Loading
- 13 Connectorized PTP 600 Series Bridge
- 13.1 Scope
- 13.2 Product Description
- 13.3 Software/Features
- 13.4 Deployment Considerations
- 13.5 Link Budget
- 13.6 Regulatory Issues with Connectorized Units
- 13.7 Installation
- 13.7.1 Antenna Choice
- 13.7.2 Cables and Connectors
- 13.7.3 Tools
- 13.7.4 Miscellaneous supplies
- 13.7.5 Mounting the Connectorized 600 Series Bridge
- 13.7.6 Mounting the antennas
- 13.7.7 Alignment Process
- 13.7.8 Aligning Dual Polar Antennas
- 13.7.9 Aligning Separate Antennas
- 13.7.10 Completing the Installation
- 13.7.11 Antenna Cable Fixing
- 13.7.12 Antenna Connection Weatherproofing
- 13.8 Additional Lightning Protection
- 14 TDD Synchronization Configuration and Installation Guide
- 15 E1/T1 Installation Guide
- 16 Data Rate Calculations
- 17 AES Encryption Upgrade
- 18 Remote Software Upgrade by TFTP
- 19 Legal and Regulatory Notices
- 19.1 Important Note on Modifications
- 19.2 National and Regional Regulatory Notices – PTP 49600 variant
- 19.3 National and Regional Regulatory Notices – PTP 59600 variant
- 19.4 National and Regional Regulatory Notices – PTP 58600 variant
- 19.5 National and Regional Regulatory Notices – PTP 54600 Variant
- 19.6 National and Regional Regulatory Notices – PTP 25600 Variant
- 19.7 Exposure
- 19.8 Legal Notices
- 20 Specifications
- 20.1 System Specifications
- 20.1.1 Wireless PTP 25600 Variant
- 20.1.2 Wireless PTP 45600 Variant
- 20.1.3 Wireless PTP 48600 Variant
- 20.1.4 Wireless PTP 49600 Variant
- 20.1.5 Wireless PTP 54600 Variant
- 20.1.6 Wireless PTP 58600 Variant
- 20.1.7 Wireless PTP 59600 Variant
- 20.1.8 Management
- 20.1.9 Ethernet Bridging
- 20.1.10 Physical
- 20.1.11 Powering
- 20.1.12 Telecoms Interface
- 20.2 Safety Compliance
- 20.3 EMC Emissions Compliance
- 20.4 EMC Immunity Compliance
- 20.5 Radio Certifications
- 20.6 Environmental Specifications
- 20.7 System Connections
- 20.1 System Specifications
- 21 FAQs
- 22 Glossary
- 23 Index

8 Web Page Reference
188
Figure 87 - Spectrum Management as seen from the Slave
NOTE: These plots are for 30 MHz operation; 5/10/15/20 MHz operation is similar - the width
of the vertical green bar represents the channel width.
Figure 86 shows an example Spectrum Management webpage as seen from the master.
Figure 87 shows an example Spectrum Management we
bpage as seen from the slave. It
should be noted that the key configuration attributes are not available on the slave web page.