
User's Manual
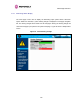


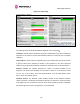

Table Of Contents
- PTP 600 User Guide
- Copyright Information
- Contents
- 1 About This User Guide
- 2 Avoiding Hazards
- Getting Started
- 4 Product Architecture
- 5 Radio Link Planning and Regulations
- 5.1 Spectrum Planning
- 5.2 Licenses and Region Codes
- 5.3 Operational Restrictions
- 5.4 Variable Channel Bandwidth Operation
- 5.5 PTP 25600 Specific Frequency Planning Considerations
- 5.6 PTP 45600 Specific Frequency Planning Considerations
- 5.7 PTP 48600 Specific Frequency Planning Considerations
- 5.8 PTP 49600 Specific Frequency Planning Considerations
- 5.9 PTP 54600 Specific Frequency Planning Considerations
- 5.10 PTP 58600 Specific Frequency Planning Considerations
- 5.11 PTP 59600 Specific Frequency Planning Considerations
- 5.12 Time Division Duplex (TDD) Synchronization
- 5.13 Link Mode Optimization
- 5.14 Distance
- 5.15 Networking Information
- 5.16 Lightning Protection
- 5.17 Electrical Requirements
- 5.18 Latency
- 6 Site Planning
- 6.1 Site Survey and Link Planning
- 6.2 Site Selection Criteria
- 6.2.1 ODU Site Selection
- 6.2.2 PTP 600 Series Bridge PIDU Plus Site Selection
- 6.2.3 Path Loss Considerations
- 6.2.4 Definitions
- 6.2.5 PTP 25600 System Threshold, Output Power and Link Loss
- 6.2.6 PTP 45600 System Threshold, Output Power and Link Loss
- 6.2.7 PTP 48600 System Threshold, Output Power and Link Loss
- 6.2.8 PTP 49600 System Threshold, Output Power and Link Loss
- 6.2.9 PTP 54600 System Threshold, Output Power and Link Loss
- 6.2.10 PTP 58600 System Threshold, Output Power and Link Loss
- 6.2.11 PTP 59600 System Threshold, Output Power and Link Loss
- 7 Installation
- 7.1 Preparation
- 7.2 Installation Procedure
- 7.3 Tools Required
- 7.4 Installation Support
- 7.5 Legal Disclaimer
- 7.6 Mounting the ODUs
- 7.7 Connecting Up
- 7.7.1 Preparing the PIDU Plus To ODU Cable
- 7.7.2 Making the Connections at the ODU
- 7.7.3 Making the PTP 600 Series Bridge PIDU Plus Connection At The ODU
- 7.7.4 Routing the Cable
- 7.7.5 Fitting a Lightning Protection Unit
- 7.7.6 Grounding the Installation
- 7.7.7 Making the ODU Connection at the PTP 600 Series Bridge PIDU Plus
- 7.7.8 Making the Network Connection at The PIDU Plus – PTP 600 Series Bridge
- 7.7.9 Mounting the PTP 600 Series Bridge PIDU Plus
- 7.7.10 Powering Up
- 7.8 Establishing a Radio Link
- 8 Web Page Reference
- 8.1 Home Page – PTP 600 Series Bridge
- 8.2 Systems Status Page
- 8.3 System Administration Pages
- 8.3.1 System Configuration
- 8.3.2 Statistics Page
- 8.3.3 Detailed Counters Page
- 8.3.4 Install Pages
- 8.3.5 Graphical Install
- 8.3.6 Software Upgrade
- 8.3.7 Spectrum Management
- 8.3.8 Spectrum Management (Fixed Frequency)
- 8.3.9 Spectrum Management Control - With Operational Restrictions
- 8.3.10 Spectrum Management – Example of PTP 25600 Product variant
- 8.3.11 Remote Management Page
- 8.3.12 Diagnostics
- 8.3.13 Change System Administration Password
- 8.3.14 License Key
- 8.3.15 Properties
- 8.3.16 Reboot
- 9 Recovery Mode
- 10 Lightning Protection
- 10.1 Overview
- 10.2 Detailed Installation
- 10.3 Installation Wiring
- 10.4 LPU Recommended Configurations
- 10.4.1 Typical Mast or Tower Installation
- 10.4.2 Typical Wall Installation
- 10.4.3 Mast or Tower Installation with E1/T1
- 10.4.4 Wall Installation with E1/T1
- 10.4.5 Mast or Tower Installation with GPS Sync Box
- 10.4.6 Wall Installation with GPS Sync Box
- 10.4.7 Mast or Tower Installation with GPS Sync Box and E1/T1
- 10.4.8 Wall Installation with GPS Sync Box and E1/T1
- 11 Troubleshooting (Fault Finding)
- 12 Wind Loading
- 13 Connectorized PTP 600 Series Bridge
- 13.1 Scope
- 13.2 Product Description
- 13.3 Software/Features
- 13.4 Deployment Considerations
- 13.5 Link Budget
- 13.6 Regulatory Issues with Connectorized Units
- 13.7 Installation
- 13.7.1 Antenna Choice
- 13.7.2 Cables and Connectors
- 13.7.3 Tools
- 13.7.4 Miscellaneous supplies
- 13.7.5 Mounting the Connectorized 600 Series Bridge
- 13.7.6 Mounting the antennas
- 13.7.7 Alignment Process
- 13.7.8 Aligning Dual Polar Antennas
- 13.7.9 Aligning Separate Antennas
- 13.7.10 Completing the Installation
- 13.7.11 Antenna Cable Fixing
- 13.7.12 Antenna Connection Weatherproofing
- 13.8 Additional Lightning Protection
- 14 TDD Synchronization Configuration and Installation Guide
- 15 E1/T1 Installation Guide
- 16 Data Rate Calculations
- 17 AES Encryption Upgrade
- 18 Remote Software Upgrade by TFTP
- 19 Legal and Regulatory Notices
- 19.1 Important Note on Modifications
- 19.2 National and Regional Regulatory Notices – PTP 49600 variant
- 19.3 National and Regional Regulatory Notices – PTP 59600 variant
- 19.4 National and Regional Regulatory Notices – PTP 58600 variant
- 19.5 National and Regional Regulatory Notices – PTP 54600 Variant
- 19.6 National and Regional Regulatory Notices – PTP 25600 Variant
- 19.7 Exposure
- 19.8 Legal Notices
- 20 Specifications
- 20.1 System Specifications
- 20.1.1 Wireless PTP 25600 Variant
- 20.1.2 Wireless PTP 45600 Variant
- 20.1.3 Wireless PTP 48600 Variant
- 20.1.4 Wireless PTP 49600 Variant
- 20.1.5 Wireless PTP 54600 Variant
- 20.1.6 Wireless PTP 58600 Variant
- 20.1.7 Wireless PTP 59600 Variant
- 20.1.8 Management
- 20.1.9 Ethernet Bridging
- 20.1.10 Physical
- 20.1.11 Powering
- 20.1.12 Telecoms Interface
- 20.2 Safety Compliance
- 20.3 EMC Emissions Compliance
- 20.4 EMC Immunity Compliance
- 20.5 Radio Certifications
- 20.6 Environmental Specifications
- 20.7 System Connections
- 20.1 System Specifications
- 21 FAQs
- 22 Glossary
- 23 Index

8 Web Page Reference
138
Vector Error: The vector error measurement compares the received signal’s In phase /
Quadrature (IQ) modulation characteristics to an ideal signal to determine the composite error
vector magnitude. The results are stored in an histogram and expressed in dB and presented
as: max, mean, min and latest. The max, min and latest are true instantaneous
measurements; the mean is the mean of a set of one second means. The expected range for
Vector Error would be approximately -2dB (NLOS link operating at sensitivity limit on BPSK
0.67) to –33dB (short LOS link running 256 QAM 0.83). See Section 8.2.1 “Histogram Data”.
Link Los
s: The link loss is the total attenuation of the wireless signal between the two
point-to-point units. See Section 8.2.1 “Histogram Data”..
The lin
k loss calculation presented below:
Equation 3 - Link Loss
xxxx
RTRTll
ggPPP
+
+
−
=
Where is
ll
P
Link Loss (dB)
x
T
P
Transmit power of the remote wireless unit
(dBm)
x
R
P
Received signal power at the local unit
(dBm)
xx
RT
gg ,
Antenna gain at the remote and local units
respectively (dBi). The antenna gain of the
600 Series bridge (23.5 dBi) is used unless
one or both of the units is a Connectorized
version.
Transmit Data Rate: The data rate in the transmit direction, expressed in Mbps and
presented as: max, mean, min, and latest in an histogram format. The max, min and latest
are true instantaneous measurements; the mean is the mean of a set of one second means.
See Section 8.2.1 “Histogram Data”. Expected data rates can be found in Section 16 “Data
Rate Calculat
ions”.
Receive Data Rate: The data rate in the receive direction, expressed in Mbps and presented
as: max, mean, min, and latest in an histogram format. The max, min and latest are true
instantaneous measurements; the mean is the mean of a set of one second means. See
Section 8.2.1 “Histogram Data”. Expected data rates can be found in Section 16 “Data Rate
Cal
culations”.