
Solar Thermal Information

27
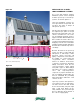
OPERATION OF A DRAINBACK SYSTEM:
The solar heat collection cycle in a drainback system is controlled
the same way as that in an antifreeze-based system. When the
collector sensor reaches a temperature a few degrees above
that of the tank sensor, the circulator(s) are turned on.
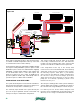
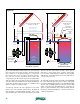
A drainback system might contain two circulators in series, or a
single “high head” circulator. In either case, the circulator(s) push
water up through the piping and collector array. Air is pushed
ahead of this water and eventually back to the space at the top
of the storage tank. The water level within the tank drops slightly
during this process. There is no need of either a high-point air
vent (as required in an antifreeze-based system) or a vacuum
breaker at the top of the collector circuit.
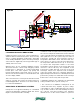
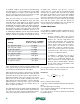
With proper pipe sizing, the flow velocity in the piping returning
from the collector array allows air bubbles to be entrained with
the water and returned to the top of the storage tank. As this
occurs, a siphon is formed within the return piping. This siphon
eventually cancels out most of the initial “lift head” associated
with filling the collector array.
Once the siphon is established, it is usually possible to turn
off the upper of two series-connected circulators, or reduce
the speed of a single high-head circulator, and still maintain
adequate flow through the collector array.
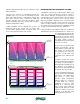
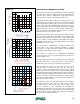
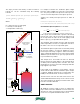
The sequence of operation of a “dual-pumped” drainback
system using two series-connected fixed-speed circulators is
depicted in figure 5-5.
The upper graph shows the effective pump curve of two identical
fixed-speed circulators connected in series. It is constructed by
doubling the head of the single circulator at each flow rate.
Both circulators are turned on each time the solar energy
collection process begins. During the first few seconds of
operation, water is lifted upward through the collector supply
piping. This causes the system curve to migrate upward along
the graph as depicted by the light blue dashed lines labeled t1,
t2 and t3 in the upper graph. Notice that these curves steepen as
they rise. This is due to the frictional resistance of water flowing
through more piping and the collector array as flow approaches
the top of the collector circuit.
The dark blue system curve labeled t4 represents the situation
as water “rounds the turn” at the top of the collector circuit.
The intersection of this system curve and the pump curve
for two circulators in series establishes the instantaneous
operating point marked as OP4. The flow rate associated with
this operating point can be read from the horizontal axis directly
below this point. For the example shown in figure 5-5, this flow
rate is about 5.7 gallons per minute.
system curve after
siphon is established
0
5
10
15
20
25
30
35
40
0 2 4 6 8 10 12 14 16
flow rate (gpm)
head added / loss (feet)
0
5
10
15
20
25
30
35
40
0 2 4 6 8 10 12 14 16
flow rate (gpm)
head added (feet)
two circulators in series
single circulator
t4 t5 t6 t7 t8
off
OP4
OP8
stable flow rate with
one circulator off
1
0
5
10
15
20
25
30
35
40
0 2 4 6 8 10 12 14 16
flow rate (gpm)
head added /
lost (feet)
system curve
as water reaches top
of collector loop
this flow rate must produce a
flow
velocity
of at least 2 ft/sec
in the return pipe from the collectors
lift head
t0
t1
t2
t3
t4
OP4
2
3
figure 5-5