
Instruction Manual


Chemometrics
NIRCal 5.5 Manual, Version A 193
3.18.68 Q-Values
Description
Value between 0 and 1. 0 means a bad 1 would be a good calibration. But 1
cannot be reached.
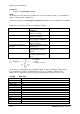
Q-Values depending on the number of PCs.
There is a warning limit for the stored calibration:
0.8 for qualitative
0.6 for quantitative
Use
Select the number of secondary PC according the highest Q-Value.
Method
PCR / PLS / Cluster (CLU) / SIMCA
Matrices ID
64
Tip
In generell: the highest the Q-Value the better the calibration.
Details
The Q-Value is in the calibration protocol, see explanation: LINK: Calibration
Protocol Qualitative
It is used for selection of the best calibrations for the automatic Calibration
wizard.
Related Topic
Quant Calib. Statistics, Cluster per Property, Spectra Residuals too big
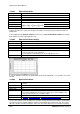
Explanation of the Q-Value calculation of quantitative calibration:
Value
Weights
Formula for value
General term
Aspects of a
good
calibration
Detail
wNum
NotC
10
Number of C-Set spectra
with Residual too big
Rejection of
known
Rejection
count of known
should be 0
wNum
NotV
1
Number of V-Set spectra
with Residual too big
Rejection of
unknown
Rejection
count of
unknown
should be 0
wQa
2
Abs (SEE-SEP)/
(Abs(SEP)+1.0)
Relative
Consistency
C-Set and V-
Set should
have similar
low standard
error of
prediction
BIAS
corrected
wQb
2
Abs (VsetBIAS)/
Abs(Range)
Weighted
BIAS
The absolute
V-Set BIAS
should be low
wQc
1
1-VsetRegr
Validity
The V-Set
regression
coefficient
should be near
1
wQd
1
Abs( CsetRegr-VsetRegr)
Comparability
C-Set and V-
Set should
have similar
high
regression
wQe
1
SEP / Abs(Range)
Precision
The V-Set
standard error
of prediction
should be low
BIAS
corrected
wQf
1
Abs(RSS)/Abs(Range)
Weighted
Accuracy
The V-Set
Residual Sum
of squares=
RSS should be
low
not BIAS
corrected