
Installation Instructions
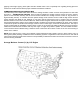
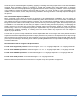
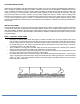
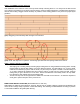
Table Of Contents
- APPLICATIONS
- HANDLE WITH CARE
- OWNER/INSTALLER RESPONSIBILITIES
- JOB SITE INSPECTION
- VENTILATED CRAWL SPACES
- (pic1)
- SUMMER/WINTER MOISTURE CONTENT MAP
- The effects of Temperatures and Humidity on wood flooring
- GENERAL INFORMATION - all installations
- HELPFUL TOOLS
- NAILDOWN OVERVIEW
- WOOD SUBFLOORS
- Note that joist spacing determines minimum subfloor thickness.
- Wood floor orientation
- Flatness
- CAUTION: Do not sand any surfaces containing lead-based paints, finishes, or asbestos.
- When using air compressors
- Use of Pneumatic Staplers and Nailers
- Recommended Fastener Lengths and Specifications
- NAILDOWN INSTRUCTIONS
- INSTALLATION PREP
- STEP 1: THE FIRST THREE ROWS
- STEP 2: FLOORING LAYOUT (Racking)
- STEP 3: INSTALLATION CONTINUED
- STEP 4: FINISHING UP
- Congratulations on your new Brazilian Pecan hardwood floor!

gapping, board-edge cupping, finish splits and other related issues. This is especially true regarding flooring placed in
seasonal or vacation homes without proper ventilation and climate conditions.
SUMMER/WINTER MOISTURE CONTENT MAP
The USDA map of the United States below shows the average moisture content of interior wood products for each state
and region. – SEE MOISTURE TESTING. The first number indicates the average moisture content of wood in January
(winter or lower humidity months), and the second number indicates the average moisture content in July (summer or
higher humidity months). To calculate what the optimal average wood moisture content is add the high season and low
season together, then divide by two. Example: If your region has an expected low of 6% to a high of 12%, the average
baseline moisture content of the wood would be 9%. When wood flooring has achieved the average in moisture content for
the geographical location and the proper relative humidity conditions are present the installation can begin. If the moisture
content of the product is outside of the average moisture content of that region, extend the acclimation time. This map is
merely a helpful guide for installation, actual moisture content in any location may differ significantly from these numbers.
Ideal interior environmental conditions will vary from region to region and jobsite to jobsite. The most reliable moisture-
content numbers will be obtained using a moisture meter to determine the moisture content of the new wood flooring in
relation to the subfloor.
NOTE; Some regions of the country are moderate in both temperatures and humidity. Homes in these regions may not
have typical (HVAC) Heating, Ventilation and Air-conditioning systems to regulate the indoor environment. In this and all
cases, it is the flooring professional or homeowner’s responsibility to determine the indoor environment or moisture content of
the wood flooring is suitable.
Average Moisture Content (%) by U.S. Region