
(Supporting Network Advisor 12.3.0)
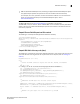
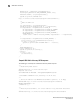
Table Of Contents
- Contents
- About This Document
- Overview of the Network Advisor REST API
- Getting Started
- Using the Brocade Network Advisor REST API
- Introduction
- Logging in and out
- Specifying content type
- Versioning (backward compatibility)
- Using the Topology API
- Using the SAN Fabric Discovery API
- Using the Traffic Flow API
- Using the Summary Data API
- Using the Events API
- Using the Zoning API
- Using the Historical Performance Data API
- Fibre Channel Routing
- Handling errors
- Use Cases
- API Reference
- Request and Response Schemas
- Topology
- SAN fabric discovery
- Summary data
- SummaryResponse
- StatusSummary
- AssetClassificationSummary
- NetworkObjectCountSummary
- EventsSummary
- BottleneckViolationsSummary
- OutOfRangeViolationsSummary
- PortHealthViolationsSummary
- VmViolationsSummary
- SummariesResponse
- PortsMonitorSummaryData
- MonitorDistributionData
- ProductsMonitorSummaryData
- FlowMonitorSummaryData
- Events
- Zoning
- Historical performance data
- Authentication and session management
44 Brocade Network Advisor REST API Guide
53-1003160-01
Getting the Top N CRC errors port summary
4
InSeconds":1402019999,"value":0.005,"lo":0.0,"hi":0.012,"sum":0.0},{"timeInSecond
s":1402018199,"value":0.008499999999999999,"lo":0.004,"hi":0.013,"sum":0.0},{"tim
eInSeconds":1402016399,"value":0.007666666666666666,"lo":0.0,"hi":0.014,"sum":0.0
},{"timeInSeconds":1402014599,"value":0.006833333333333333,"lo":0.0,"hi":0.013,"s
um":0.0}]},{"targetKey":"fldbid-12","targetType":"FLOW","timeSeriesDatas":[{"time
InSeconds":1402023599,"value":0.0,"lo":0.0,"hi":0.0,"sum":0.0},{"timeInSeconds":1
402021799,"value":0.0,"lo":0.0,"hi":0.0,"sum":0.0},{"timeInSeconds":1402019999,"v
alue":0.0,"lo":0.0,"hi":0.0,"sum":0.0},{"timeInSeconds":1402018199,"value":0.0,"l
o":0.0,"hi":0.0,"sum":0.0},{"timeInSeconds":1402016399,"value":0.0,"lo":0.0,"hi":
0.0,"sum":0.0},{"timeInSeconds":1402014599,"value":0.0,"lo":0.0,"hi":0.0,"sum":0.
0}]}],"granularity":"GRANULARITY_30MIN","duration":null,"startDate":1402012800000
,"endDate":1402023600000}
In this response, you can see the value for Transmit Frame Rate within the provided start and end
times. Each entry has the target key specified and this can be used in combination with the flow
data you received from the previous flows response to plot the data.
Getting the Top N CRC errors port summary
Physical layer errors cause signal degradation on the transmitter or receiver end and results in loss
of transmitted data. The most common physical layer error reported is the CRC error which
indicates frame corruption. CRC errors along with “encode out” errors usually point to a cabling or
SFP-related problem.
The Network Advisor REST API supports the retrieval of summary information for various
performance measures such as CRC errors, C3 discards, and BB credit zero.
For example, if you are interested in getting the top 10 ports reporting CRC errors, perform the
following steps.
1. Establish a REST API session with Network Advisor (refer to “Logging in”).
The network consisting of the fabrics is assumed to be discovered in Network Advisor. If not,
you can use the Network Advisor client or the Network Advisor REST API to discover the fabrics
of interest (refer to “SAN fabric discovery”).
2. Use the following GET URI for retrieving the top 10 ports reporting CRC errors.
<BASE_URI>/resourcegroups/{rgkey}/crcerrors?timeline=<value>×cope=<value>&l
imit=<value>&portscope=<value>&descending=<value>
SAN fabric discovery
Discovering an FC fabric
The Network Advisor REST API provides support for SAN Fabric discovery through the following
POST URI:
<Base_URI>/resourcegroups/All/discoverfabric
When calling this URI, you must pass the following:
• Session token
This token is returned in an HTTP header (WSToken) after a successful login request.