
(Supporting Network Advisor 12.3.0)
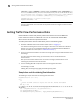
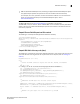
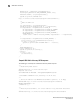
Table Of Contents
- Contents
- About This Document
- Overview of the Network Advisor REST API
- Getting Started
- Using the Brocade Network Advisor REST API
- Introduction
- Logging in and out
- Specifying content type
- Versioning (backward compatibility)
- Using the Topology API
- Using the SAN Fabric Discovery API
- Using the Traffic Flow API
- Using the Summary Data API
- Using the Events API
- Using the Zoning API
- Using the Historical Performance Data API
- Fibre Channel Routing
- Handling errors
- Use Cases
- API Reference
- Request and Response Schemas
- Topology
- SAN fabric discovery
- Summary data
- SummaryResponse
- StatusSummary
- AssetClassificationSummary
- NetworkObjectCountSummary
- EventsSummary
- BottleneckViolationsSummary
- OutOfRangeViolationsSummary
- PortHealthViolationsSummary
- VmViolationsSummary
- SummariesResponse
- PortsMonitorSummaryData
- MonitorDistributionData
- ProductsMonitorSummaryData
- FlowMonitorSummaryData
- Events
- Zoning
- Historical performance data
- Authentication and session management

40 Brocade Network Advisor REST API Guide
53-1003160-01
Getting Traffic Flow Performance Data
4
51E530B93","type":"STANDARD","active":true,"aliasNames":null,"memberNames":["
10:00:00:05:1E:53:0B:93","20:01:00:11:0D:C6:01:01","20:06:00:11:0D:C6:01:01"]
}],"zonealiases":null,"zonesets":[{"key":"NARestZoneSet-true","name":"NARestZ
oneSet","active":true,"zoneNames":["NARestZone_100000051E530B93"]}]}]}
CALLING POST http://10.24.48.103/rest/logout
REQUEST HTTPSTATUS = 204
NOTE
The text in bold shows that a zone with the requested initiator and targets has been created
and activated.
Getting Traffic Flow Performance Data
Network Advisor collects and persists performance data for the various SCSI and
Frame measures related to traffic flows. You can use the Network Advisor REST
API to retrieve this historical performance data.
To collect performance data for traffic flows, perform the following steps.
1. Establish a REST API session with Network Advisor (refer to “Logging in”).
The network consisting of the initiator and targets is assumed to be discovered in Network
Advisor. If not, you can use the Network Advisor client or the Network Advisor REST API to
discover the fabrics of interest (refer to “SAN fabric discovery”).
2. Set up the monitor flows between the initiator and target ports using the Network Advisor client
flow dialogs.
For more information about setting up monitor flows, refer to the Network Advisor
documentation.
After you create the flow definitions for the initiator and target, Network Advisor starts
collecting the performance data for the flows.
3. Use the following GET URI and pseudo code for retrieving flow information.
The following is the URI.
<BASE_URI>/resourcegroups/{rgkey}/fcswitches/{fcskey}/flows
Sample Java code for retrieving flow information
The following is sample Java code for retrieving flow information.
HttpURLConnection con = null;
try {
/**
* Create the HTTP connection object with the URI, method and headers
*/
URL obj = new
URL("http://10.24.48.103/rest/resourcegroups/All/fcswitches/10:00:00:05:33:13:78:
7E/flows");
con = (HttpURLConnection) obj.openConnection();
con.setRequestMethod("GET");
con.addRequestProperty("WStoken", "wppCy/NGdC4o5gGFJjXRMv7blhc=");