
(Supporting Network Advisor 12.3.0)
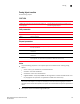
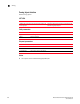
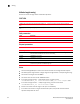
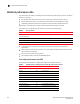
Table Of Contents
- Contents
- About This Document
- Overview of the Network Advisor REST API
- Getting Started
- Using the Brocade Network Advisor REST API
- Introduction
- Logging in and out
- Specifying content type
- Versioning (backward compatibility)
- Using the Topology API
- Using the SAN Fabric Discovery API
- Using the Traffic Flow API
- Using the Summary Data API
- Using the Events API
- Using the Zoning API
- Using the Historical Performance Data API
- Fibre Channel Routing
- Handling errors
- Use Cases
- API Reference
- Request and Response Schemas
- Topology
- SAN fabric discovery
- Summary data
- SummaryResponse
- StatusSummary
- AssetClassificationSummary
- NetworkObjectCountSummary
- EventsSummary
- BottleneckViolationsSummary
- OutOfRangeViolationsSummary
- PortHealthViolationsSummary
- VmViolationsSummary
- SummariesResponse
- PortsMonitorSummaryData
- MonitorDistributionData
- ProductsMonitorSummaryData
- FlowMonitorSummaryData
- Events
- Zoning
- Historical performance data
- Authentication and session management
134 Brocade Network Advisor REST API Guide
53-1003160-01
Historical performance data
5
Historical performance data
This section lists the URIs for retrieving historical performance data for ports, switches, and flows
based on a measure:
• Port performance data can be retrieved in the context of a resource group or switch.
• Switch performance data can be retrieved in the context of a resource group or fabric.
• Traffic flow performance data can be retrieved in the context of a specific switch only.
Depending on the scope of the context, the relevant performance data is returned.
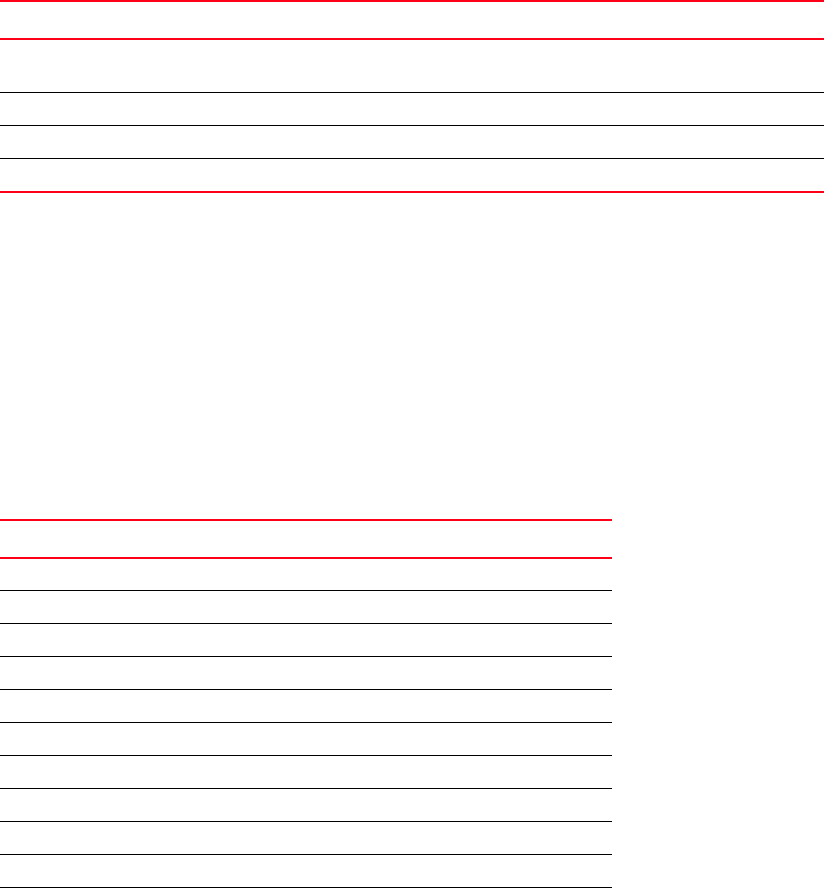
In the URIs, you can specify query parameters as shown in the following table.
• If all the parameters (duration, start date and end date) are provided, duration takes
precedence.
• If the duration is less than or equal to 0, then it will default to 3600 seconds unless the start
and end dates are specified.
• The start and end dates are long values.
• The response schema is PerformanceDataResponse
Port-related performance data URIs
The following table shows the mapping of the URIs to the specific measures.
TABLE 8 Query parameters
Name Type Default value
duration (expressed in seconds) (takes precedence over
start and end dates)
long 3600 seconds (1 hour)
startdate (date expressed as a long milliseconds value) long N/A
enddate (date expressed as a long milliseconds value) long N/A
granularity TimeSeriesGranularity GRANULARITY_MINIMUM
TABLE 9 Mapping of the port-related performance data URIs to the specific measures
Measure Type URI
Port Utilization Percentage FC timeseriesutilpercentage
Traffic FC timeseriestraffic
CRC Errors FC timeseriescrcerrors
Link Resets FC timeserieslinkresets
Signal Losses FC timeseriessignallosses
Sync Losses FC timeseriessynclosses
Link Failures FC timeserieslinkfailures
Sequence Errors FC timeseriessequenceerrors
Invalid Transmissions FC timeseriesinvalidtransmissions
C3 Discards FC timeseriesc3discards
C3 Discards TX TO FC timeseriesc3discardstxto