
Technical data


ServerIron ADX Graphical User Interface Guide 125
53-1002412-01
Chapter
9
Monitoring Overview
In this chapter
•Navigating the monitoring tab . . . . . . . . . . . . . . . . . . . . . . . . . . . . . . . . . . . 125
Navigating the monitoring tab
The Monitor tab is the third tab in the ADX web interface. You can use the Monitor tab to monitor
the system, network, traffic, or security settings on an ADX device. When you click the Monitor tab,
the following menus are displayed in the menu bar.
• System—Allows you to view the information specific to system summary and system logs.
• Network—Allows you to view the information specific to interfaces, IP statistics, Address
Resolution Protocol (ARP), and Media Access Control (MAC).
• Traffic— Allows you to view the information specific to virtual server, real server, health checks,
content switching, scripts, and sessions.
• Security—Allows you to view the information specific to Secure Socket Layer (SSL) and
Distributed Denial of Service (DDoS) protection.
By default, the ADX web interface displays the System menu after you click the Monitor tab.
Click a menu that represents the primary task that you want to perform from the menu bar, the
corresponding entities specific to the menu are displayed in the sidebar. From the sidebar, select
an entity that represents a configuration feature. The corresponding Summary page with a list of
configured entities specific to the feature, in tabular format, is displayed in the main page.
For example, when you select the Real Servers entity from the sidebar, the main page displays a
summary page with the list of real servers configured on the device. The list displays all the
configured entries with 30 entries in each page. You can navigate to view the next or previous set of
configuration information by clicking Next or Previous at the bottom of the Summary page. Click
First or Last to go to the most recent or least recent entries. Also, you can select the page number
from the list, to go to a specific page. To view the detailed statistics of a feature, select an entry
from the list and click Details at the bottom of the Summary page.
The statistical data can be viewed in graphical or tabular format. You are allowed to switch between
tabular and graphical format. To switch the view, click Graph or Details on the top right corner of
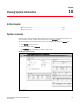
that page. For example, click the Network menu from the menu bar and select IP from the sidebar
to view the IP configuration information statistics as shown in Figure 101. The option to view the
statistical data in graphical format is present only to some of the pages.
In graphical view, some of the graphs appear by default. To view or hide the graphs based on
various networking parameters, select or clear the check boxes corresponding to the graphs that
you want to view from the Select Graph list. You can also click the close button that is displayed on
the each individual graphs to close the graph. Select the legend check boxes to plot the relevant
statistics data on the graph.