
Datasheet


12
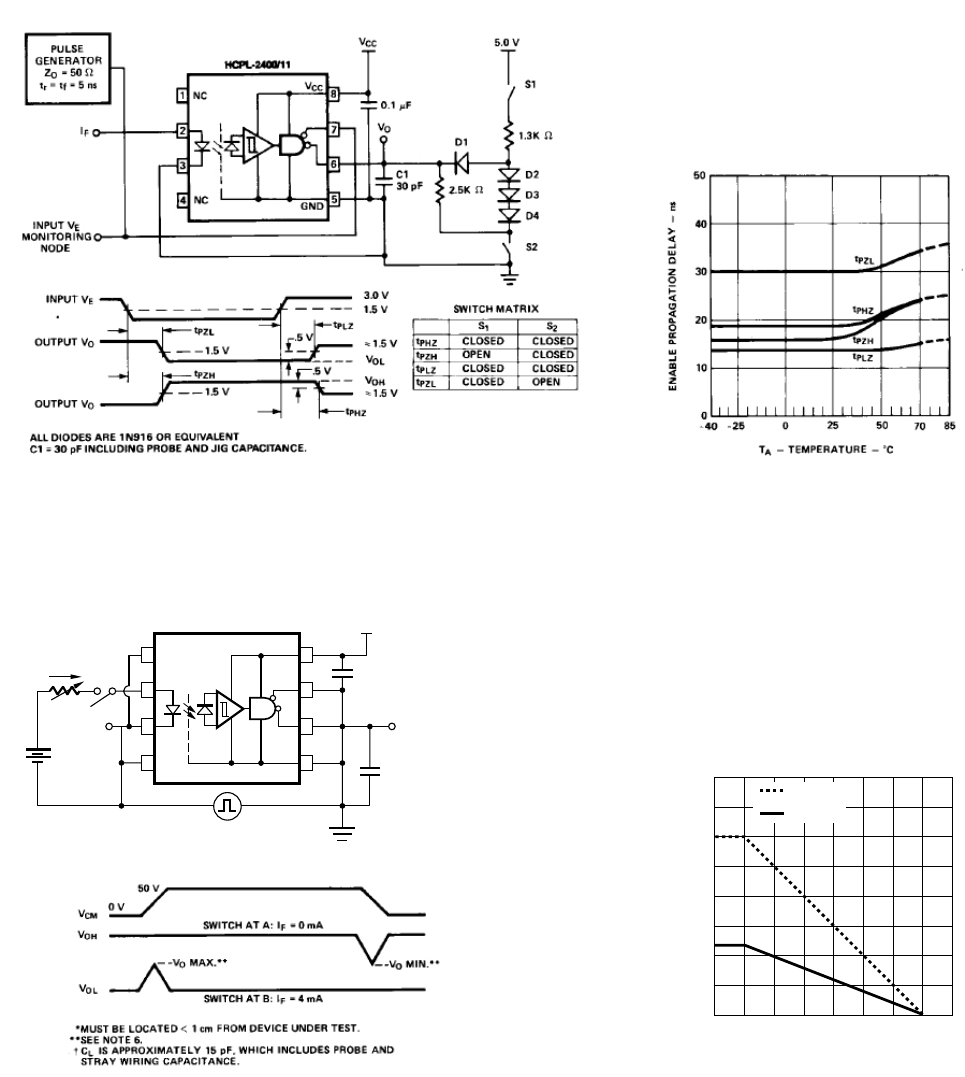
Figure 9. Test circuit for t
PHZ
, t
PZH
, t
PLZ
and t
PZL
. Figure 10. Typical enable propagation delay vs. ambi-
ent temperature.
Figure 11. Test diagram for common mode transient immunity and typical waveforms.
Figure 12. Thermal derating curve, dependence of
safety limiting value with case temperature per
IEC/EN/DIN EN 60747-5-2.
HCPL-2400 fig 12
OUTPUT POWER – P
S
, INPUT CURRENT – I
S
0
0
T
S
– CASE TEMPERATURE – °C
20050
400
12525 75 100 150
600
800
200
100
300
500
700
P
S
(mW)
I
S
(mA)
175
0.1 µF *
V
FF
+
–
F
I
CC
V
GND
NC
NC
CM
V
+
–
7
5
6
8
2
3
4
1
C = 15 pF
A
B
PULSE GENERATOR
L
CC
V
OUTPUT V
MONITORING NODE
O
HCPL-2400/11
†
HCPL-2400 fig 11a