
Installation & Operating Guide


25
7.5
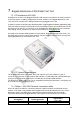
Backsense CAN Radar Test Tool
The Brigade test tool is a windows application that enables users to view all physical detection
data from the radar system in real time.
The test tool consists of a main Graphic & Control Window displaying a top-down view of
detected objects for one selected sensor as well as a sub window for that sensor’s detection
data and another sub window displaying detected object positions for all sensors in the
network. The Test Tool does not provide any CAN data from the sensor network however the.
Configuration Tool detailed in section 7.6 enables the user to view live CAN data and
configure the Base ID for individual sensors. Each part of the test tool is explained in the
following sections. For operating errors, see section 7.7
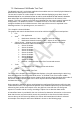
7.5.1 Graphic & Control Window
The graphic and control window feature a menu bar with the following menus and options:
▪ File
▪ View
➢ Exit Application
➢ Backsense Detection Table – Opens in new sub window.
➢ Backsense Network Summary Table – Opens in new sub window.
▪ Select Sensor – Change sensor selection for top-down detection view and
Backsense Detection Table from below list:
➢ Sensor ID 0x310.
➢ Sensor ID 0x320.
➢ Sensor ID 0x330.
➢ Sensor ID 0x340.
➢ Sensor ID 0x350.
➢ Sensor ID 0x360.
➢ Sensor ID 0x370.
➢ Sensor ID 0x380.
➢ Sensor ID 0x390.
➢ Refresh – Refreshes the above list of connected sensors.
▪ Tools
➢ Configuration Tool – Opens in new sub window.
▪ About
➢ About Radar Test Tool.
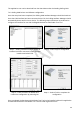
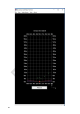
The centre of the Graphic and Control Window displays a 2m grid representing the 60m long,
16m wide detection area for one BS-9100 sensor. A red filled circle at the bottom middle
position of the grid represents the sensor location whilst purple triangle hatchings either side of
the sensor location represent the area in which objects cannot be detected due to the
120°detection angle.
During operation, detected objects are displayed as small green filled squares within the 60m
x 16m detection area. The approximate position of the detected objects may be estimated by
referencing their position with respect to the 4m grid lines. Note that the size of all green
squares is constant and do not vary according to object size or detection data values.
A Pause/Run button is provided for the user to freeze live detection information on the screen.
Note that the user may select which sensor they would like to view from the Select Sensor
menu at the top of the screen. By default, the sensor with lowest base ID value is selected.
An example of the Graphic and Control Window is shown on the following page.