
Operation Manual
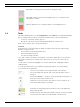
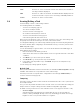
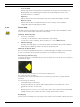

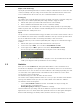
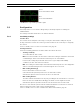


Table Of Contents
- IVA 4.0
- Table of Contents
- 1 Introduction
- 2 Requirements
- 3 Configuration
- 4 IVA 4.0
- 5 IVA 4.0 Flow
- 6 IVA and VG4 AutoDome
- 7 Display of Units of Measurement
- Index

56 en | IVA 4.0 Flow IVA 4.0
DOC | 4.0 | 2009.06 Operating Manual Bosch Security Systems
Adaption time window [s]:
Specify the period during which there must be activity for a main flow to be detected. In this
context, an activity is the percentage of the monitored area in which a flow is detected. As
soon as a main flow is detected as such, the counterflow will also be detected.
Activity [%]
The activity of the counterflow that is to trigger an alarm event can be restricted. Change the
values if you do not want a particularly low or high activity to trigger an alarm.
1. Activate this option if you wish to filter flows based on their activity.
2. Enter a minimum and maximum value for the counterflow activity.
The selected values are displayed on the camera image during input by a respectively high
number of yellow dots. The number of arrows indicating the detected counter flow is directly
proportional to the activity in the area.
Speed
The speed of the counterflow that is to trigger an alarm event can be restricted. As the camera
is not calibrated to detect flows, no definitive indication of the speed can be provided. Flow
speeds are indicated in relation to the background and/or other movements.
Change the values if you do not want a particularly low or high-speed counterflow to trigger
an alarm.
1. Activate this option if you wish to filter flows based on their speed.
2. For the lowest speed Min., choose between Slow, Medium and Fast.
3. For the highest speed Max., again choose between Slow, Medium and Fast.
The selected speeds are indicated by two moving dots on the camera image.
4. Move or rotate this field with the mouse and place it over an area with a flow. This will
enable you to align the flow speed with the selected settings.
5.5 Statistics
When you select the Statistics tab, histograms with statistics on the relevant detected
movements are displayed on the right-hand side of the window, either for a selected field or
for the whole screen. You can either select the field in the camera image by clicking it or click
one of the tabs on the right-hand side of the window. A tab is shown here for the whole
screen and for each respective field.
The statistics help you to refine the filter criteria for flows.
The creation of the displayed statistics starts as soon as you open the IVA 4.0 Flow window.
The longer the window is left open, the more values will be entered into the statistics.
The statistics show four histograms:
–One for slow, medium and fast movements: accumulation of objects moving at a
specified speed in a certain direction.
– Activity Histogram [% of area] : accumulation of activity
The lines indicate the percentage of flows for which the respective value was detected. The
higher the line, the more flows matched the particular criterion. The histograms distinguish
between flows that trigger an alarm (red line) and those that do not (green line).