
Operation Manual


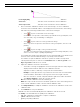
Table Of Contents
- IVA 4.0
- Table of Contents
- 1 Introduction
- 2 Requirements
- 3 Configuration
- 4 IVA 4.0
- 5 IVA 4.0 Flow
- 6 IVA and VG4 AutoDome
- 7 Display of Units of Measurement
- Index

38 en | IVA 4.0 IVA 4.0
DOC | 4.0 | 2009.06 Operating Manual Bosch Security Systems
3. For each of the properties, select how exactly they must correspond for an object to be
detected as being similar to this object.
The Precision slide control sets the accuracy progressively.
– Slide control set to the left:
Property is ignored.
– Slide control set almost to the left:
Property is considered, correspondence can be very inaccurate.
– Slide control set to the right:
Property is considered, correspondence must be very accurate.
The further to the right the slide control is set, the more accurate the description of the
property of the searched object that is to trigger an alarm.
4.6 Statistics
When you select the Statistics tab, three histograms with statistics on the relevant detected
objects are displayed on the right-hand side of the window, either for a selected field or for
the whole screen. You can either select the field in the camera image by clicking it or click one
of the tabs on the right-hand side of the window. A tab is shown here for the whole screen
and for each respective field.
The statistics help you to refine the filter criteria for objects. For example, you may see
accumulations of objects that have not triggered an alarm under the current filter criteria even
though this might have been desirable.
The creation of the displayed statistics starts as soon as you open the IVA 4.0 window. The
longer the window is left open, the more values will be entered into the statistics.
The statistics show three histograms:
– Object Area Histogram [m²]: accumulation of objects with a certain area.
– Object Speed Histogram [km/h]: accumulation of objects moving at a certain speed.
– Object Direction Histogram [°]: accumulation of objects moving in a certain direction.
The lines indicate the percentage of objects for which the respective value was detected. The
higher the line, the more objects matched the particular criterion. The histograms distinguish
between objects that trigger an alarm (red line) and those that do not (green line).
The x-axis of the top two histograms (area, speed) automatically adapts.
Displayed as the highest value here is the highest detected value up to this point.
Click Reset to begin building statistics again.
4.7 Configuration
This tab provides access to basic settings that you should specify before defining the
individual tasks:
– Section 4.7.1 Calibration, page 39
Green:
set of objects with no alarm
Red:
set of objects with alarm