
Technical information


4
New Tool Helps Diagnose CAN Bus Faults
GM has released new diagnostic soft-
ware to help technicians identify a start-
ing point in diagnosing faults in a CAN
bus (GM also calls this a LAN) by look
-
ing at how connectors and wiring are
working or not working. With this infor
-
mation, diagnostic time can be reduced
for intermittent electrical conditions.
The new Data Bus Diagnostic Tool
is an application that uses existing
GM Multiple Diagnostic Interface
(MDI) or Bosch Mastertech Vehicle
Communication Interface (VCI) tool
functionality. You will use your MDI or
VCI tool, a computer with access to
the web-based Techline Information
System (TIS2Web), and an active
TIS license.
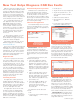
To download the software, click the
GDS 2 software application icon on
the TIS2Web home page. A prompt to
install the software will appear.
Aftermarket subscribers can access
GDS2 by logging in to TIS2Web at
www.acdelcotds.com.
Due to the increased functionality and
additional value of GDS2, there will be
a small price increase for future GDS2
subscriptions. The short-term software
fees will increase $2 in the US for the
3-day and monthly subscriptions, and
$25 for annual subscriptions.
Diagnostic Aids
If there's a high speed communica-
tion issue and 20 U codes set in every
module, those DTCs aren't very useful
in narrowing down the concern. The
new Data Bus Diagnostic Tool software
will show counts of each module and
how often it's NOT communicating.
This very quickly identifies the problem
module, and provides a quick point of
diagnosis for checking the connectors,
terminals and wiring for that module.
It's proven extremely useful in field
testing for these issues.
Localizing the Fault
The application actively queries all
possible diagnostic addresses to see
what modules are on the bus. Modules
that respond are on the ‘good’ part of
the bus. Modules that don’t respond
are on the ‘bad’ part of the bus.
The application doesn’t know what
modules a vehicle is equipped with,
so it can’t report which modules are
missing. Compare the list of modules
displayed in the application against that
vehicle’s schematics in the appropriate
GM Service Information.
Determine Physical Layer Status
CAN buses have characteristic volt-
ages under different fault conditions.
By monitoring bus voltage, it’s possible
to identify whether or not the bus is
physically OK. It’s also possible to iden
-
tify the type of fault that’s present (CAN
LO/HI open, short, ground offsets, etc)
by monitoring bus voltage.
Three-In-One Application
The Data Bus Diagnostic Tool is actu-
ally three sub-applications in one. Each
one has its own tab on the application's
graphic interface.
Detected State – Identifies which
control modules are responding to
diagnostic requests, and identifies the
physical state of the vehicle bus being
diagnosed (open, short, ground offset,
etc)
In performing these functions, this
tab does three things:
1. It provides a diagnostic starting
point. All possible ECUs are sent
simultaneous requests at a rate of
250 ms. The application tracks and
displays the longest time it takes for
each ECU to respond to a diagnostic
request to help with intermittent
faults.
2. It tries to identify what's going on
with the wires that make up the
bus (OK, CAN LO/HI open, CAN LO/
HI shorted to ground, ground off
-
sets, enable line open/blown fuse/
power faults, etc.).
3. It provides audible feedback. You
can set the application to beep
continuously when a fault is
detected or when the bus appears
electrically OK.
The states that can be detected
include:
• OK
• Single wire opens (CAN LO Open,
CAN HI Open)
• Double opens
• Single wire shorts to power/ground
• Single wire open/short (i.e., the
wire is broken and the far side is
shorted)
• CAN LO shorted to CAN HI
• Ground offsets (i.e., bad ECU
grounds)
• Power faults (open supply, blown
fuse, broken enable line, etc)
Using the Detected State, if a bus
has a break point in communication,
some modules on the “good” side of
the faulted bus will respond very inter
-
mittently. When diagnosing intermittent
faults, pay attention to the ECU with
the longest response time and use the
electrical schematic to identify the mod
-
ules that did not communicate during
the Detected State procedure.
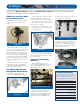
Measured Voltage – Provides a low
speed voltage trace of the selected
bus, CAN LO and CAN HI. Due to cur
-
rent MDI limitations, it refreshes at
about 1 ms, so it's not as fast as an
oscilloscope. It also won't let you see
the individual bits in a CAN frame (CAN
frames take about 0.25 ms to transmit).
It is, however, very visually obvious
when a fault is introduced or removed.
Message Monitor – Passively moni-
tors bus activity to help diagnose bat-
tery drain problems. This tab works on
Single Wire CAN only.
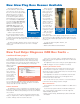
A. Detected State
B. Measured Voltage
C. Message Monitor
Detected State identifies the physical
state of the selected bus.
Measured voltage on two pins of a CAN.
continued on page 5